
Page 53 - 2022_03-Haematologica-web
P. 53
Clonal evolution in relapsed/refractory CLL cases
Clonal expansion or reduction of individual sub-clones over time and with treatment
Integrating tumor purity, copy number state (Online Supplementary Figure S3) and AF, we inferred the CCF (Online Supplementary Table S8) affected by individual mutations as described before.4 In some patients and phas- es, known cancer drivers listed in the COSMIC mutation database could be linked to the changes in CCF (Online Supplementary Figure S4; gene symbols from COSMIC highlighted in purple). For example, HU-1-13 showed a mutation in the cancer driver EGFR only in the untreated and refractory sample (CCF 7% coverage 33 and CCF 66%, coverage 57) (Online Supplementary Figure S4). The mutation was undetected (coverage 48) at relapse indicat- ing a reduction of this clone below the detection limit at relapse. Furthermore, the fraction of cells carrying an ANO1 mutation steadily increased from 0% over 2.3% to 22.0% in the refractory sample (coverage 48, 42 and 41). Interestingly, the major clone present at the relapse and characterized by an NLRP13 mutation (CCF 28.5%, cov- erage 21) was not detected any more in the refractory sample (coverage 25), indicating that this clone was lost during treatment or during progress.
HU-1-19 displayed similar shifts albeit with a different clonal composition, but also with elimination of a clone
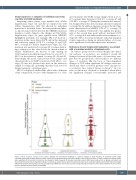
Figure 3. Allele frequency changes across phases. Between two consecutive
nucleotide polymorphism (SNP) shown as circles. Circles are grouped according
cally, regardless of the number of mutations, the changes in allele frequency of all single nucleotide variants (SNV) were clustered into six groups per patient and the average of these groups is depicted resulting in six circles per patient phase. Black line represents phase mean. Statistical significance of allele frequency change differences between clinical phases was tested using Kruskal-Wallis test and P-value corrected using 100,000 permutations of the phase labels for the six mutation clusters representing each patient (P=0.00262).
after treatment. The EGR2 variant changed from 2.1% to 27% mutant allele frequency (CCF 4%, coverage 47 and CCF 55%, coverage 37) during the treatment-free interval, but dropped below the detection limit after first treatment (coverage 56). In addition, the major clone at the first time point characterized by MARK2 (CCF 37%, coverage 74) without treatment (“untreated”) was slightly less promi- nent at the second time point without treatment (CCF 34%, coverage 54) and undetectable after treatment (cov- erage 60). These observations indicate a gradual change in clonal composition during an untreated phase of 6 years and a significant clonal replacement after treatment.
Refractory chronic lymphocytic leukemia is associated with a branched evolution of leukemic cells
In order to group observed clonal changes into differ- ent patterns of evolution, we analyzed overall AF changes between all possible pairs of consecutive sam- ples that we grouped into disease phases for different types of evolution. On the basis of time-dependent changes of CCF, when significant AF changes were uni- directional, these evolution patterns were classified as co-evolution (also termed “linear evolution”).22 In con- trast, evolution was classified as “branched” when differ- ent significant changes concomitantly increased and
samplings in a patient, changes in allele frequency of clustered somatic single to the clinical phase at the second time point. In order to weigh each patient identi-
haematologica | 2022; 107(3)
609
