
Page 52 - 2022_03-Haematologica-web
P. 52
M. Zapatka et al.
sition. Although one might expect the occurrence of clonal evolution with the acquisition of new variants in tumors with relapse after therapy, we observed the opposite: such clinical phases show the same mutational landscapes both at baseline and at relapse, and major shifts in AF occurred only exceptionally (Figure 2). In sharp contrast, during phases of therapy refractoriness, we found dramatic alter- ations in clonal composition (Figures 2 and 3). Notably, in refractory phases these increases and reductions in AF occurred within relatively short time intervals (median phase length: refractory 707 days, relapse 2,395 days, untreated 2,088 days, time span refractory phases vs. time span untreated, treated and relapsed Mann-Whitney test P=0.00014; Online Supplementary Table S1), that were par- ticularly much shorter than the phases in stable or relapsed cases. The high degree of AF changes and the short time window over which these changes occurred indicate marked dynamics in the clonal shift, often notable in tumors that appeared clinically unaffected by therapy (i.e., without remission and subsequent
regrowth). These clonal shifts clearly indicate a change in the clonal composition, and strikingly they occur mostly during refractory phases, i.e., during treatment that does not successfully affect the clinical outcome.
We further quantified overall AF changes in the three different groups of clinical phases independent of the fur- ther course of disease (Figure 3, changes in AF over time provided in the Online Supplementary Figure S2). Clearly, a substantially higher variation of AF is seen in the samples that reach the therapy refractory phase. Comparison of 28 subsequent time points in 25 patients identified significant differences in the AF changes over time between different types of clinical phases, which indicates that the degree of change in the clonal composition is different in the three clinical groups (Kruskal-Wallis test P=0.00262, corrected based on permutation of phase labels). Furthermore, the untreated phases showed a significantly lower AF change over time independent of the extent of time between sam- pling (P<0.01 for untreated vs. relapsed and untreated vs. relapsed/refractory; Online Supplementary Table S7).
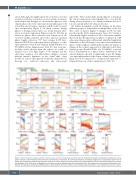
Figure 2. Allele frequency changes during the clinical course of chronic lymphocytic leukemia patients. Overall clinical phase is depicted by colored bars on top (green=untreated, yellow=relapsed after treatment, red=refractory to treatment). The individual treatments and disease progressions are depicted in the first row of each graph with gray bars representing treatment, while green, yellow, orange and red bars indicate the type of treatment response and disease progression. Richter transformation in HU-1-32 (blue) is highlighted in the second row, above the alternative allele frequencies (aAF). aAF changes are colored based on hierarchical clus- tering of the trajectories following by identifying the six major clusters (R function cutree). y-axis: indicates allele frequencies, x-axis: indicates time course in years.
608
haematologica | 2022; 107(3)
