
Page 55 - 2022_03-Haematologica-web
P. 55
Clonal evolution in relapsed/refractory CLL cases
decreased in CCF between consecutive samplings and were thus “bidirectional”.
As depicted in Figure 4A, we observed in the group of long-term untreated patients phases in the clinical course where substantial shifts in the clonal composition occurred only after treatment. These shifts resulted either in co-evo- lution of few sub-clones while other sub-clones were lost (e.g., HU-1-15), or a simultaneous decrease and increase of different subclones indicative of branched evolution. Long- term untreated phases display mainly co-evolution pat- terns (four of five), while only one patient (HU-1-19), who required treatment after 6 years, followed a branched evo- lution pattern and became refractory to a subsequent treat- ment. In phases preceding relapse, co-evolution appeared less frequent (three of five). Instead, relapsed and refractory CLL showed a tendency towards more frequent branched evolution than untreated CLL (six of ten vs. one of five, Fisher exact test P=0.28), a pattern that was e.g., observed in the relapsed and treatment refractory phases of a single patient (HU-1-13). Interestingly, this patient was treated with FCR (fludarabine, cyclophosphamide, rituximab) in 2005 and in 2009 again achieving a complete response (CR) each time, but at the second time with shorter duration.
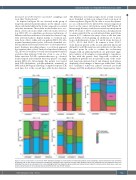
The differences in evolution types shows a trend towards more branched evolution in relapsed and even more in refractory phases (Figure 4B). In order to assess the dynam- ics on a cellular level we inferred the clonal composition based on the cancer cell fractions using TrAP (Figure 5). Interestingly the major subclone at refractory time point in HU-1-19 (clone 3, 41.5% clone fraction) is already present to a minor extend at the second untreated time point (clone fraction 2.0%) whereas the major clone at the first time point further evolved gaining an additional set of muta- tions subdividing into clones 4, 5 and 6 (clone fraction of 13.7%, 21.3% and 10.5%). In contrast a clone (19.0% clone fraction) present at the second untreated time point defined by an EGR2 mutation was undetected at the other last time point. In order to confirm the evolutionary changes with an additional method, we performed epige- netic analysis of 20 samples corresponding to ten phases. In line with the genetic data, large-scale evolution of methylation patterns was not present in any of the evalu- ated long-term untreated (n=3) and relapsed (n=2) phases displaying clonal changes of linear type while three of the five examined refractory phases featured profound changes in DNA methylation (Online Supplementary Figure
Figure 5. Clonal composition as inferred by TrAP. Exemplary changes in clone fraction for individual patients across samplings. Clonal composition was estimated by applying TrAP on the cancer cell fraction calculated for individual single nucleotide variants (SNV). Different clones are represented by the respective colors and individual time points are indicated on the x-axis. Highlighted with the respective gene symbols are inferred clones linked to a known cancer driver gene. y-axis rep- resents clonal fraction of the individual clones identified for the best fit TrAP solution.
haematologica | 2022; 107(3)
611
