
Page 223 - 2022_01-Haematologica-web
P. 223
Shallow-depth sequencing of lymphoma cell-free DNA
score in addition (Figure 2B), which significantly associates the latter categorical variables (P=0.004; Fisher exact test).
The sensitivity and specificity of EBV detection through sWGS of cfDNA was established by a comparison with routine CISH for EBER detection results, performed on FFPE tissue. All 18 samples that tested positive for EBER, as well as 8/46 EBER-negative samples, had abnormally-increased EBV levels in plasma, achieving a sensitivity and specificity of 100% and 82.6%, respectively (Figure 2B; Online Supplementary File S2: Tables S3 and S4). The liquid biopsies with the highest viral read fractions of the EBER-negative cases did, however, accommodate increased levels of EBV fragments in blood, as confirmed by a subsequent PCR analysis (Figure 2B). This indicates that routine CISH might have inadequate sensitivity or that viral fragments may have been absent in the tumor cells studied. When consid- ering the latter five as true positives, specificity increases to 93.5%.
As for the copy number alteration amplitudes, liquid biopsies had higher (P=0.039; paired Wilcoxon signed-rank test) EBV read fractions than solid biopsies (Figure 2C). To conclude, three receiver operating characteristic (ROC) analyses (Figure 2D) were included to further demonstrate
the performance of this EBV detection approach. Ranked plasma EBV viral read fractions and three different gold standards were used: CISH overridden by PCR (area under the curve [AUC]=0.994); CISH only (AUC=0.948); and solid biopsy reads (AUC=0.868).
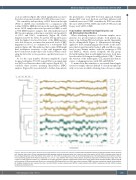
Copy numbers derived from liquid biopsies can aid histological classification
When visualizing fractions of aberrant samples across genomic loci per histological subtype, both general (e.g., gains at 2p, holding REL) and subtype-specific fingerprints can be distinguished (Figure 3). Unsupervised clustering26 applied to these summarizing profiles results in the antici- pated histological hierarchy. Indeed, nHL and HL are sepa- rated as two definite entities, with the exception of GZL and PMBCL, which cluster alongside the HL group. Notwithstanding their non-Hodgkin histology, both have been described as being molecularly related to HL,27,28 hence the structure of the dendrogram. GZL in particular demon- strates overlapping features with cHL and PMBCL.28
To mimic how this translates as a potential clinical appli- cation for samples that are difficult to classify morphologi- cally, or in cases in which obtaining tumor tissue is compli-
Figure 3. Overview of aberrations detected using liquid biopsies across lymphoma subtypes. Colored waves represent fractions of aberrant samples across genomic loci. Patterns above the y=0 lines indicate gains whilst opposite contours represent losses (e.g., when the top of the wave is at 50%, 50% of samples have a gain at the corresponding locus; when the bottom of the wave is at 10%, 10% of samples have a loss at the corresponding locus). The dendrogram (left) results from hierar- chical clustering applied to the Pearson distances (i.e., d = [1 – r]/2) between the means of these waves. Graph lines represent smoothened mean log2 ratios. The number of used baseline samples (n) is indicated on the right-hand side. Subtypes represented by fewer than three patients were excluded. DLBCL: diffuse large B- cell lymphoma; GCB: germinal center B-cell; unc: unclassified; EBV: Epstein-Barr virus; GZL: grey zone lymphoma; PMBCL: primary mediastinal large B-cell lymphoma; HL: Hodgkin lymphoma; cHL: classical HL; ncHL: non-cHL; NSCHL: nodular sclerosis cHL; MCCHL: mixed cellularity cHL; LRCHL: lymphocyte-rich cHL; NLPHL: nodular lymphocyte predominant HL.
haematologica | 2022; 107(1)
215
