
Page 224 - 2022_01-Haematologica-web
P. 224
L. Raman et al.
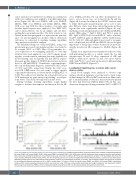
cated, random forest predictive modeling, in combination with cross-validation, was applied to four differential diag- noses (Figure 4A): HL versus DLBCL; cHL versus PMBCL; DLBCL, NOS versus PMBCL; and within DLBCL, NOS, GCB versus non-GCB. For these analyses, obviously only baseline liquid biopsies were employed. Two ROC AUC can be discussed here: one for all samples and one disre- garding flat copy number profiles. The latter statistic is con- sidered in the next paragraph as it represents the perform- ance of a rational application: profiles without aberrations will never be subjected to machine learning algorithms since predictions would be random.
The differential diagnosis of HL and DLBCL, using com- putationally-processed copy number profiles, was found to be accurate (AUC of 0.967). Out of bag principles (i.e., cross-validation for bootstrapping methods, to overcome train/test bias) were applied to a set of 119 samples, mean- ing that, at each iteration, sufficient data were available for model training; and, biologically, HL and DLBCL express divergent profiles (Figure 3). PMBCL has features between those of cHL and DLBCL.27 Nonetheless, copy number pro- files can aid differential diagnoses, indicated by AUC values of 0.931 and 0.981, respectively. Finally, the GCB versus non-GCB COO status does not seem to trigger specific copy number alterations, as shown by the resulting AUC of 0.450. We could not test whether the activated B-cell versus GCB distinction by gene expression profiling29 would per- form better. This should be explored in future work.
During training, learning algorithms assign higher weights to features that improve classification. For the HL
versus DLBCL problem, the top three discriminative fea- tures - or loci, in our case - are located at 2p, 9p and 11q (Figure 4B, bottom). In addition, the GISTIC software aims to define driver genes in pattern peaks across a set of sam- ples. Of note, there were three interesting peaks in these regions that were significantly enriched (Figure 4B, top), matching several anticipated genes: in both HL and DLBCL, 2p16.1 (REL) gains;30,31 9p24.1 (JAK2 and PD-L1) gains in HL;32 9p21.3 (CDKN2A) losses in DLBCL;33 and to conclude, 11q23.3 (CEP164) gains in DLBCL34 (Online Supplementary File S2: Table S5). Although 2p16.1 was found to be ampli- fied, or duplicated, in both HL and DLBCL, the model gives importance to the 2p arm, as these aberrations are more fre- quently detected in HL compared to DLBCL (Figure 4B, top).35
Finally, locus importance was examined for the two other well-performing models: to a certain extent, 5p, 9q, and chromosomes 14 and 19 allow separation of cHL and PMBCL, while more specific 7p and, once more, 9p24.1 (JAK2 and PD-L1)32 cytobands are decisive in differentiating DLBCL from PMBCL (Figure 4C).
Longitudinal liquid biopsies correlate with overall disease status
Serial blood samples were analyzed to observe copy number alteration dynamics over time and to study longi- tudinal changes in CPA and EBV read fractions. One exam- ple of an intra-patient evolution is demonstrated by patient 32, who had refractory DLBCL (Figure 5A). In this case, alterations disappeared during treatment (MTV on PET/CT
AB
C
Figure 4. Feasibility of copy number profiles as a clinical lymphoma subtyping tool. (A) ROC analysis following out of bag random forest modeling to differentially diagnose HL versus DLBCL; cHL versus PMBCL; DLBCL, NOS versus PMBCL; and within DLBCL, NOS, GCB versus non-GCB. Exclusively, blood samples at baseline were included. ROC curves when omitting flat profiles (i.e., only CPA abnormal cases) are shown in addition. (B) The top plot is generated as in Figure 3. The black graph line shows the mean absolute difference between these profiles. The four horizontal grey bars are colored at significantly-enriched aberration peaks, assumed to hold driver genes, detected by GISTIC (gains on top, losses below; yellow for DLBCL, green for HL; emphasized by (inverted) ‘V’ symbols). The plot below visualizes the importance of regions for the differential diagnosis according to a HL vs. DLBCL random forest. (C) Similar to (B) but for the cHL versus PMBCL and DLBCL, NOS versus PMBCL classification problems. ROC: receiver operating characteristic; AUC: area under the curve; CPA: copy number profile abnormality; HL: Hodgkin lymphoma; cHL: classical HL; DLBCL: diffuse large B-cell lymphoma; PMBCL: primary mediastinal large B-cell lymphoma; NOS: not otherwise specified; GCB: germinal center B-cell.
216
haematologica | 2022; 107(1)
