
Page 222 - 2022_01-Haematologica-web
P. 222
L. Raman et al.
liquid and solid biopsies (Figure 1E). These numbers were averaged per sample and additionally normalized by subtracting the mean across the control samples (0.005 for liquid; 0.026 for solid), which results in a fairer comparison, as FFPE material tends to produce profiles with higher levels of noise,24 naturally increasing the overall deviance. This variable was found to be higher in liquid than in solid biopsies for HL (P=0.010; paired t- test), but not for DLBCL (P=0.316; paired t-test). Worthy of note is that, within HL, the mean of the solid biopsies barely varied from zero, meaning that most of these pro- files are hard to differentiate from normal controls, and, therefore, the low liquid-solid correlation observed in HL patients (Figure 1D), seems to be caused by a scarcity of tumor cells in the FFPE samples rather than a low ctDNA fraction. From a biological perspective, this is reasonable: neoplastic Hodgkin and Reed-Sternberg cells are always embedded in an inflammatory background of non-affect- ed cells,25 causing resemblance to healthy tissue.
A
Shallow-depth sequencing of cell-free DNA enables sensitive Epstein-Barr virus detection in lymphoma
Sequencing reads were mapped to seven different lym- phoma-associated viruses. Of the lymphoma liquid biop- sies, 39/216 had abnormally-elevated EBV read fractions compared to the negative controls (Online Supplementary File S2: Table S3); whereas one patient tested positive for JC polyomavirus (13 reads) at surveillance (patient 79). In accordance with clinical records, no other viruses were detected. Within control samples, no or exclusively low amounts of EBV reads were noted. The latter was the case for 15/60 liquid (read fraction range 0.032-0.059 parts per million [ppm]) and 6/9 solid controls (0.029-0.08 ppm).
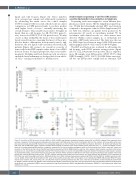
The EBV read fraction was evaluated for all baseline liq- uid biopsies, with 28/123 patients testing positive (Figure 2A). For GZL, 2/4 patients were positive, and, as expected, more HL samples were EBV-positive (15/38; 39.5%) than DLBCL samples (11/81; 13.6%) (P=0.004; Fisher exact test). All but one EBV-positive sample had an abnormal CPA
BCD
Figure 2. Feasibility of EBV detection through sWGS of cfDNA. (A) EBV read fraction comparison between common HL and DLBCL subtypes. Dots represent blood samples at baseline. The bottom grey box delineates the abnormality cutoff defined by the controls. According to this limit, the numbers at the top define which sam- ples have abnormally-elevated EBV fractions. The overlapping histograms on the left display the overall EBV read fraction distribution. (B) Scatter plot between the CPA score and the EBV read fraction. Symbols represent blood samples at baseline; color shows whether CPA is abnormal; the + or – symbol is assigned in accor- dance to A, thereby specifying EBV positivity or negativity, respectively. Pie charts visualize contingency table; the P-value results from Fisher’s exact test. Swarm and box plots on the right-hand side indicate the EBV read fraction, grouped by CISH for EBER detection outcome. Dots represent blood samples; numbers at the top are assigned as in A. Colored dots are additionally tested by PCR in blood samples. (C) Control-normalized EBV comparison between the liquid and solid biopsies. Samples are represented by dots; same-patient biopsies are connected. Patients without elevated an EBV level in both their solid and liquid biopsy were omitted. The P-value results from a paired Wilcoxon rank-sum test. (D) ROC analyses executed using ranked viral-read fractions and three different gold standards: CISH, overridden by PCR; CISH only; solid biopsy EBV read fraction. EBV: Epstein-Barr virus; sWGS: shallow whole-genome sequencing; cfDNA: cell-free DNA; HL: Hodgkin lymphoma; nHL: non-HL; DLBCL: diffuse large B-cell lymphoma; CPA: copy number profile abnormality; CISH: chromogenic in situ hybridization; EBER: EBV-encoded RNA; PCR: poly- merase chain reaction; cHL: classical HL; ncH:, non-cHL; ROC: receiver operating characteristic; AUC: area under the curve; NLPHL: nodular lymphocyte predominant HL; NSCHL: nodular sclerosis cHL; MCCHL: mixed cellularity cHL; LRCHL: lymphocyte-rich cHL; GZL: grey zone lymphoma; NOS: not otherwise specified; GCB: germinal center B-cell; unc: unclassified; PMBCL: primary mediastinal large B-cell lymphoma; HGBCL: high-grade B-cell lymphoma; THRLBCL: T-cell/histiocyte-rich large B-cell lymphoma; c: control.
214
haematologica | 2022; 107(1)
