
Page 221 - 2022_01-Haematologica-web
P. 221
Shallow-depth sequencing of lymphoma cell-free DNA
Results
Shallow-depth sequencing of cell-free DNA enables accurate copy number profiling in lymphoma
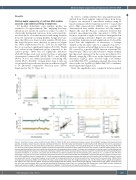
For healthy individuals, copy number profiles are assumed to be approximately ‘flat’, implying that large alterations are absent. In a previous study,20 in order to statistically distinguish cancerous from control profiles, we developed a score that increases with rising deviance from the naturally-occurring healthy background vari- ance: the CPA score. Based on this variable, 95/123 base- line liquid biopsies were detected as cancerous (Figure 1A; Online Supplementary File S2: Table S3). As expected, the score reached significantly higher (P<0.001; Welch test) values in the lymphoma group compared to the control group. There was no significant difference (P=0.250; Fisher exact test) in the fraction of abnormal observations between HL (32/38; 84.2%) and DLBCL (60/81; 74.1%), nor when specifically considering cHL (31/35; 88.6%; P=0.091). At Ann Arbor stage I, only one of six liquid biopsies showed deviations whereas stage II to IV presented comparable detection rates (Online Supplementary File S1: Figure S1).
A
In order to confirm whether the copy number profiles derived from blood samples represent those from tissue biopsies, we executed a concordance analysis using 33 liquid-solid pairs (Online Supplementary File 1: Liquid-solid pairs). One representative DLBCL case, patient 59, demonstrated very similar deviations in both samples (Figure 1B), and the Pearson correlation between this patient’s smoothened profiles amounted to 0.916. We can note, from left to right, four clusters distinguished in a corresponding scatter plot (Figure 1C): deletions, copy neutral bins, duplications and amplifications. It should be noted that the amplitudes of alterations, a concept defined as the absolute value of a segment’s log2 ratio,19 are more extreme in liquid than in tissue biopsies (Figure 1B), caused by a greater ctDNA fraction in patient 59’s liquid biopsy. This is also indicated by a steeper identity line than least squares fit in the scatter plot (Figure 1C). Overall, when the CPA score in the liquid biopsy was abnormal, DLBCL pairs showed high concordance (r=0.815±0.043; 95% confidence interval). However, this was not the case for HL (r=0.260±0.055; 95% confidence interval) patients (Figure 1D).
Next, the amplitudes were compared between paired
BCDE
Figure 1. Feasibility of copy number profiling through sWGS of cfDNA. (A) CPA score comparison between common HL and DLBCL subtypes. Dots represent blood samples at baseline; default box plots indicate underlying distributions. The bottom grey box delineates the abnormality cutoff defined by the controls. According to this limit, the numbers at the top define which samples have abnormal copy number profiles. The overlapping histograms on the left display the overall CPA distribu- tion. (B) Copy number profile comparison between the liquid and solid biopsy of patient 59. Dots are bins for which copy number is inferred whereas graph lines rep- resent smoothened profiles. The ‘ratio’ equals the observed over the expected number of reads. (C) Scatter plot comparison of bins (grey dots) and smoothened val- ues (solid black graph line) between the liquid and solid biopsy of patient 59. Identity line (black dotted) and least squares fit (red dotted), with corresponding Pearson correlation coefficient (r), are shown. (D) Scatter plot of all Pearson correlations between solid and liquid biopsy pairs, defined as in C, in relation to the CPA of the liquid biopsy. The grey box on the left matches the abnormality cutoff from A. Horizontal colored lines embedded in colored boxes represent means and their uncer- tainty (95% confidence interval), respectively. (E) Control-normalized amplitude comparison between the liquid and solid biopsies of HL and DLBCL patients. Samples are represented by dots; same-patient biopsies are connected; the underlying distribution is clarified by violin plots. P-values result from paired t-tests. sWGS: shallow whole-genome sequencing; cfDNA: cell-free DNA; CPA: copy number profile abnormality; HL: Hodgkin lymphoma; nHL: non-HL; DLBCL: diffuse large B-cell lymphoma; cHL: classical HL; ncHL: non-cHL; NLPHL: nodular lymphocyte predominant HL; NSCHL: nodular sclerosis cHL; MCCHL: mixed cellularity cHL; LRCHL: lymphocyte-rich cHL; GZL: grey zone lymphoma; NOS: not otherwise specified; GCB: germinal center B-cell; unc: unclassified; EBV: Epstein-Barr virus; PMBCL: primary mediastinal large B-cell lymphoma; HGBCL: high-grade B-cell lymphoma; THRLBCL: T-cell/histiocyte-rich large B-cell lymphoma; c, control.
haematologica | 2022; 107(1)
213
