
Page 225 - 2022_01-Haematologica-web
P. 225
Shallow-depth sequencing of lymphoma cell-free DNA
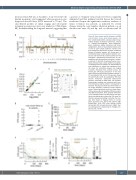
decreased from 915 cm3 at baseline to 4 cm3 between both interim moments), and reappeared when progression was diagnosed after 212 days (MTV increased to 79 cm3). The smoothened profiles at initial staging and subsequent restaging at progression were very similar (r= 0.946; Figure 5B), notwithstanding the long time interval, suggesting that
A
a portion of ‘remnant’ tumor had never been completely eliminated and that minimal residual disease had caused recidivism. Despite the significant correlation, evidence of tumor evolution was present, as indicated by several changes along the copy number alteration pattern, e.g.,on chromosome arms 2q and 6p; and on chromosome 14
Figure 5. Copy number profile dynamics and EBV read fractions across serial liquid biopsies. (A) Four smoothened profiles corresponding to longi- tudinal samples of refractory patient 32, colored in - ordered chronologically - black (diagnosis), green (response), yellow (response) and brown (progression). Arrow on top indicates relative point in time of each sample collection moment. The grey background represents the 95% confidence interval of healthy controls. (B) Scatter plot of smoothened copy number profiles between sam- ple one and four from (A). Scatter symbols are tiny characters, representing chromosomes; for per- ceptibility, each chromosome character is unique- ly colored. (C) Dot plot of pairwise Pearson corre- lations between copy number profiles at longitudi- nal staging moment. Patients are represented by solid (refractory) or dotted lines (relapsed). Each dot shows the correlation between two staging moments. Horizontal lines indicate means. (D) Swarm plot CPA score comparison of the most recent follow-up liquid biopsy between patients in CR and patients that are not. The grey box shows the abnormality cutoff. (E) Longitudinal EBV read fraction evaluation. Exclusively EBV-positive patients, according to sWGS data, are included. Same-patient samples are connected with lines. The timescale is relative, where 0 corresponds to baseline. The grey box shows the abnormality cut- off. Colors represent a patient’s current disease status. Thicker trend lines result from loess fitting. (F) The same as (E) but evaluates CPA score rather than EBV read fraction. All HL patients with follow- up are included. Swarm and box plots on the right- hand side additionally indicate the CPA score dis- tribution, grouped according to whether the sam- ples were drawn at staging, interim or surveil- lance. (G) Same as (F), but for nHL patients. EBV: Epstein-Barr virus; CPA: copy number profile abnormality; CR: complete remission; sWGS: shal- low whole-genome sequencing; HL: Hodgkin lym- phoma; nHL: non-HL.
BC
DE
FG
haematologica | 2022; 107(1)
217
