
Page 99 - 2021_12-Haematologica-web
P. 99
PVRIG blockade in acute myeloid leukemia
PVRIG blockade against KG1a targets, and more respon- sive to TIGIT blockade against SKBR3 targets. Because TIGIT binds preferentially to PVR, while PVRIG binds exclusively to PVRL2, we explored whether differential expression of the ligands on KG1a and SKBR3 could explain the different NK-cell responses to PVRIG or TIGIT blockade. Indeed, we observed that while both SKBR3 and KG1a cells have high expression of PVRL2, KG1a expressed far less PVR than SKBR3 (Figure 1J). This sug- gests that tumors expressing high levels of PVRL2 but low levels of PVR are more likely to inhibit immune cells via PVRIG, whereas when both ligands are present, inhibition via TIGIT appears to predominate. This trend was also observed with other AML cell lines (Online Supplementary Figure S2). Both AML-193 and Kasumi-1 cells were PVRL2+PVRlo (Online Supplementary Figure S2A) and were killed at significantly higher levels in the context of anti- PVRIG with PBMC from healthy donors (Online Supplementary Figure S2B and C). By contrast, ML-2 and THP-1 AML cells were PVRL2+PVR+ (Online Supplementary Figure S2A) and were significantly increased killed in the presence of anti-TIGIT rather than anti-PVRIG (Online Supplementary Figure S2D and E).
Acute myeloid leukemia patient bone marrow contains PVRL2hiPVRlo blasts and PVRIG+ natural killer cells
We next examined the expression of PVRIG, PVR and PVRL2 in AML patient bone marrow. Using multicolour flow cytometry, we distinguished various lymphoid (CD3–CD56+ NK cells, CD3+CD56+ NKT cells, CD3+CD8+ T cells, CD3+CD8– T cells), myeloid (SSChiCD14+CD11b+ monocytes) and blast (CD45loSSCint) populations collected at diagnosis (Online Supplementary Figure S3). Primary AML blasts were PVRL2+PVRlo, and PVR was expressed at higher levels on CD14+CD11b+ monocytes (Figure 2A, B, D and E). In healthy donor bone marrow samples, the CD45loSSCint immature myeloid population (gated as per Online Supplementary Figure S3) were also PVRL2+PVRlo, suggesting that high PVRL2 expression is a feature of nor- mal myeloblasts (Figure 2A and B). Nonetheless, the PVRL2hiPVRlo phenotype of the AML blasts suggested they would be a good target for PVRIG blockade, provid- ed that patient effector cells expressed PVRIG. T cells and NK cells expressed PVRIG in all AML patients tested, with higher expression in NK, NKT and CD8+ T cells and lower expression in CD8- T cells (Figure 2C and F). There was no statistical difference in PVRIG expression levels on bone
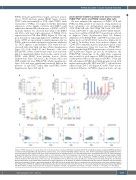
ABC
DE
F
Figure 3. PVRIG expression on natural killer cells is decreased upon activation. (A) Poliovirus receptor-related immunoglobulin domain-containing (PVRIG) expression on isolated natural killer (NK) cells after 24-hour cultured alone, or co-cultured with K562 or KG1a cells (1:1 ratio). Shown is percentage change in PVRIG mean flu- orescence intensity (MFI) relative to NK alone, each point represents an individual donor (n=3), bars represent mean ± standard deviation (SD). (B) PVRIG expression on isolated NK cells after 24-hour incubation alone or in the presence of 100 U/mL interleukin 2 (IL-2) and 10 ng/mL IL-12. Shown is percentage change in PVRIG MFI relative to NK alone, each point represents an individual donor (n=3), bars represent mean ± SD. (C) Expression of PVRIG and CD69 on isolated NK cells after 24-hour incubation with 25 U/mL IL-2, 100 U/mL IL-2, or combinations of IL-2 (100 U/mL), IL-12 (10 ng/mL), IL-15 (50 ng/mL) and IL-18 (50 ng/mL), as indicated. Representative data of two independent experiments is shown. Expression of (D) CD69 or (E) PVRIG on isolated NK cells after 24-hour incubation with the indicated plate-bound antibodies. Shown is percentage change in PVRIG MFI relative to isotype. Each donor is represented by a distinct symbol (n=3), bars represent mean ± SD. (F) Expression of PVRIG vs. CD69 on isolated NK cells after 24-hour incubation with indicated stimuli, as in (C) and (E). Significance determined by one-way ANOVA with Holm-Sidak’s multiple comparisons test (A, Dand E) or Student’s t-test (B), not significant (ns) P>0.05, *P<0.05, **P<0.01, ***P<0.001, ****P<0.0001.
haematologica | 2021; 106(12)
3119
