
Page 101 - 2021_12-Haematologica-web
P. 101
PVRIG blockade in acute myeloid leukemia
with tumor targets, NK-cell activating cytokines or via ago- nistic antibodies to NK-cell activating receptors. NK cells consistently decreased PVRIG expression after interaction with target cells, although to a much greater degree with K562 than KG1a cells (Figure 3A). This may be because K562 lacks human leukocyte antigen (HLA) class I, resulting in greater activation of the NK cells. We next investigated whether activation of NK cells via cytokines would also cause loss of PVRIG. Indeed, NK cells stimulated with IL-2 and IL-12 had significantly decreased PVRIG expression (Figure 3B). Using IL-2 or combinations of IL-2, IL-12, IL-15 and IL-18, NK cells were increasingly activated, as meas-
ured by CD69 levels. Interestingly, NK-cell surface PVRIG and CD69 levels were inversely correlated in NK cells undergoing cytokine-mediated activation (Figure 3C). Stimulation of NK cells with plate-bound agonistic antibod- ies against the activating receptors CD16, NKp46, 2B4 and NKG2D also resulted in differing levels of activation (Figure 3D) and a concomitant decrease in NK-cell PVRIG levels (Figure 3E). When PVRIG and CD69 expression was exam- ined in individual NK cells, there was a trend for more acti- vated NK cells (higher CD69) to express proportionally less PVRIG after anti-CD16 or anti-NKp46 stimulation (Figure 3F). In contrast, following cytokine stimulation NK cells
A
B
C
D
E
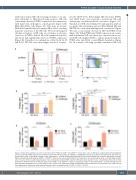
Figure 5. Differential regulation of surface and intracellular PVRIG by CD56dim and CD56bright natural killer cells. (A) Poliovirus receptor-related immunoglobulin domain-containing (PVRIG) expression on isolated natural killer (NK) cells (gated on CD56dim or CD56bright subsets) after 24-hour stimulation with 100 U/mL IL-2 and 10 ng/mL IL-12, measured by surface or total (intracellular + surface) staining. Representative of two to three experiments. (B and C) Expression of surface PVRIG on isolated NK cells (gated on CD56dim or CD56bright) after 24-hour culture with (B) 100 U/mL interleukin 2 (IL-2 )and 10 ng/mL IL-12; or (C) with K562 or KG1a cells (1:1 ratio). Shown is percentage change in mean fluorescence intensity (MFI) relative to NK alone, bars represent mean ± standard deviation (SD) of three experiments. PVRIG expression on NK cells gated on (D) CD56dim or (E) CD56bright subsets, measured by surface or total (intracellular + surface) staining after 24- hour stimulation with 100 U/mL IL-2 and 10 ng/mL IL-12. Shown is the percentage change in PVRIG MFI relative to NK alone, bars represent mean ± SD of two to three experiments. Significance determined by Student’s t-test, not significant (ns) P>0.05, *P<0.05, **P<0.01.
haematologica | 2021; 106(12)
3121
