
Page 91 - 2021_09-Haematologica-web
P. 91
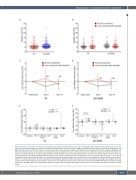
Elastography in sinusoidal obstruction syndrome
AB
CD
EF
Figure 3. Baseline and evolution of transient elastography and two-dimensional real-time shear wave elastography after allogeneic hematopoietic stem cell trans- plantation. (A) Individual baseline measure for transient elastography (TE) (5.4 kPa [range, 4.1-6.8]) and two-dimensional real-time shear wave elastography (2D- SWE) (6.0kPa [range, 4.9-7.8]) with median and interquartile value. Stars represent a patient with fibrosis before transplantation. (B) No significant difference was observed between baseline value (median and interquartile range) of patients with (red) or without (black) liver involvements (unpaired t test with Holm-Sidak cor- rections for multiple testing). (C, and D) Sequential evolution of elastography measures compared with baseline with mean and 95% Confidence Interval (CI). No sig- nificant difference was observed between patients with (red line) or without (black line) liver involvements for TE (C) and shear wave (D) at day +7 or at day+14 (unpaired t-test with Holm-Sidak correction). For each group, difference between baseline, day+7 and day+14 were not significant (Two-way ANOVA with Dunnet cor- rection for multiple comparison). (E and F) Comparison of elastography delta value (difference between measure and baseline) according to liver diagnosis (box rep- resents median and interquartile values, whiskers are minimum and maximum values) for TE (E) and shear wave (F) (Two-way ANOVA with Dunnet correction multiple comparison). 2D-SWE values were significantly increased in patients with sinusoidal obstruction syndrome (SOS) by comparison with those without liver involve- ments.
haematologica | 2021; 106(9)
2379
