
Page 92 - 2021_09-Haematologica-web
P. 92
P.-E. Debureaux et al.
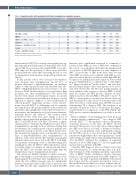
Table 3. Analyzed results with recalculated 3x2 tables including non-evaluable measures.
3x2 table
Non-evaluable results
at patient level for 2D-SWE Non- Non-
evaluable evaluable (positive) (negative)
Score performance
Se Sp PPV NPV
True- positive
2D-SWE>8.1kPa 4 EBMT 6 EBMT+2D-SWE>8.1kPa 3 Baltimore 4 Baltimore + 2D-SWE >8.1 kPa 3 Seattle 5
Seattle+2D-SWE>8.1kPa 3
2x2 table
False- False- positive negative
29 0 9 0 1 0 8 2 2 2 22 1
3 1
True- negative
97 1 11 80%
131
135
132
132
118
131
NA NA
1 1
NA NA
11
NA NA
1 2
71% 100% 94% 75% 99% 67% 94% 50% 98% 83% 84% 60% 96%
9% 99% 40% 100% 60% 99% 33% 99% 50% 98% 19% 99% 38% 99%
2D-SWE: two-dimensional real-time shear wave elastography; EBMT: European Bone Marrow Transplantation; NA: not applicable; Se: sensibility; Sp: specificity; PPV: positive pre- dictive value; NPV: negative predictive value.
underwent allo-HSCT. In our study, elastography was sig- nificantly and specifically increased in patients who devel- oped a SOS. In association with standard SOS scores, 2D- SWE improved the specificity of these scores and their positive predictive value (thus decreasing the risk of over treating patients with expensive drugs with potential side- effects).
In this patient cohort, liver biological abnormalities were frequent after transplantation. Around 39% of patients developed a hyperbilirubinemia, an incidence similar to what has previously been described after allo- HSCT.3,4 Hyperbilirubinemia has been shown to be pre- dictive of TRM3 and liver injury is associated with a high mortality rate after transplantation.26 We previously reported that clinical and biological features are poorly predictive of liver lesions and that liver biopsy is a useful approach to improve diagnosis of liver involvements in selected patients.5 Improving accuracy of liver involve- ments after allo-HSCT is challenging and we currently lack reproducible and specific markers easily available for all patients. Elastography has been widely developed as a non-invasive and quantitative tool for liver involvements, especially fibrosis and cirrhosis.27 The baseline values measured in this study were quite similar to those of healthy subjects previously published for TE (5.49+/-1.59 kPa)28 or 2D-SWE (5.19+/-1.03 kPa).29 However, a signifi- cant proportion of patients had higher basal value before transplantation, especially in those with pre-existing liver involvements. In a smaller mixed cohort of patients who underwent autologous (n=37) or allo-HSCT (n=30), base- line transient elastography values could predict the occur- rence of hyperbilirubinemia after transplantation.30 In addition, it has been shown that transient elastography and point shear wave values before allo-HSCT were high- er in patients developing severe or life-threatening liver complications after allo-HSCT.31 Our study did not identi- fy baseline values as a marker for subsequent liver injury after allo-HSCT, but baseline measures might help the interpretation of post-transplantation measures.
This study was initially designed to explore elastogra- phy for the diagnosis of all early liver complications occur- ring during the first 100 days after transplantation. In our study, the liver stiffness measure was not significantly increased in patients with GvHD, DILI or infectious dis- ease. SOS was the only complication in which 2D-SWE
measures were significantly increased as compared to baseline values. Only six cases of SOS were confirmed in this cohort, a low incidence that limits the interpretation of our data on 2D-SWE measures for early diagnosis of SOS. In rat models of SOS, point shear wave velocity with ARFI was increased in animals with SOS as com- pared to controls and was correlated with a high SOS his- tological score, inflammation and congestion, but not with fibrosis.32 Inflammation or congestion due to viral hepati- tis,33 biliary obstruction,34 cardiac failure,35 and acute lym- phoid leukemia relapse36 have been reported to be associ- ated with elevated TE. The TE value mainly depends on tissue stiffness with a region of interest (ROI) of 40-50 mm2. By contrast, 2D-SWE measure depends on tissue stiffness and viscosity with ROI of 100 mm2 or more.16 As SOS is a heterogeneous vascular liver disease character- ized by progressive sinusoid vessel obstruction that could affect viscosity, it could explain why 2D-SWE was more efficient than TE to diagnose SOS. The incidence of an unreliable TE measure (> 10%) could decrease the diagno- sis performance in comparison to 2D-SWE. Finally, 2D- SWE was not operator-dependent in our study as in oth- ers.37
Many techniques of elastography have been proposed to predict hepatic complications30,31 or to diagnose SOS after allo-HSCT.36,38,39 In a pediatric cohort of 22 patients, sequential measures of TE after allo-HSCT showed increased TE measures 3 to 6 days before clinical signs in five SOS cases (based on Seattle or Baltimore classifica- tion).38 In a second pediatric series of 25 patients, sequen- tial 2D-SWE velocity at day+5 and day+14 in five SOS patients was higher than in the control population.39 In the adult setting, one single center study including 78 patients after allo-HSCT evaluated the usefulness of sequential measures of TE for SOS diagnoses.36 TE was significantly increased in four patients with SOS.
Currently, SOS diagnosis relies on clinical criteria that have low specificity. To our knowledge, there is no pub- lished evaluation of the sensibility, specificity or predictive value of EBMT, Seattle or Baltimore criteria, using liver biopsy as a gold standard method for SOS diagnosis.8 In our cohort, one third of patients with EBMT criteria had a liver biopsy and the systematic retrospective review of their medical history helped us to better estimate the pre- dictive value of each clinical score.40 For patients who did
2380
haematologica | 2021; 106(9)
