
Page 93 - 2021_09-Haematologica-web
P. 93
Elastography in sinusoidal obstruction syndrome
AB
CD
EF
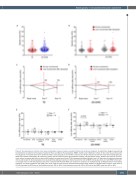
Figure 4. Two-dimensional real-time shear wave elastography measures improve sinusoidal obstruction syndrome diagnosis. (A and B) Venn diagram representing the distribution of patients with European Society for Blood and Marrow Transplantation (EBMT), Seattle and/or Baltimore Criteria in this cohort (A) and those with final diagnosis of sinusoidal obstruction syndrome (SOS) in each group (B). (C and D) ROC curves for day+14 two-dimensional real-time shear wave elastography (2D- SWE) and transient elastography (TE) measures, and box plot of individual values (box represents median and interquartile values, whiskers are minimum and max- imum values) in patients with (blue) or without SOS (yellow) for shear wave (A) and TE (B) compared with Mann-Whitney U test. (E) Radar plot of individual ultrasound criteria and box plot of ultrasonography scores (calculated by adding one point per criteria) for patients with no EBMT criteria (gray lines) and with EBMT criteria with- out (orange lines) or with SOS diagnosis (blue lines) compared with Kruskal Wallis test and Dunn’s correction for multiple testing. (F) Representation of sensibility, specificity, and positive predictive rate (PPR) (color circle, large and red circle are associated with greatest PPR). Addition of 2D-SWE measure with a cutoff value at 8.1 kPa improved the PPR value of the Seattle score from 19% to 38%, of the Baltimore score from 33% to 50% and of the EMBT score from 40% to 60%.
haematologica | 2021; 106(9)
2381
