
Page 90 - 2021_09-Haematologica-web
P. 90
P.-E. Debureaux et al.
AB
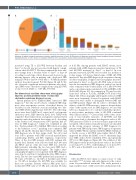
Figure 2. Description of liver blood tests involvement during the first 100 days after allogeneic hematopoietic stem cell transplantation. (A) Pie chart representing frequency of hepatic biological involvements (cytolysis, hyperbilirubinemia, or both). (B) Distribution of diagnoses according to hepatic biological disorders (cytolysis, hyperbilirubinemia, or both). Others are malignant infiltration (n=1) and aplastic anemia-related autoimmune hepatitis (n=1).
measured using TE or 2D-SWE between baseline and day+7 or day+14 was not associated with hepatic compli- cations after allo-HSCT. We then compared the liver stiff- ness change from a baseline value to day+7 or day+14 according to each type of liver disease and observed a sig- nificant increase only in patients who developed SOS using 2D-SWE at day+14 (+4.15 kPa vs. -0.5kPa in patients without liver involvement, P=0.02) (Figure 3E and F). We also observed a significant increase in patients who devel- oped SOS versus other liver complications using 2D-SWE at day +14 (+4.15 kPa vs. -0.57 kPa, P=0.018).
Two-dimensional real-time shear wave elastography improves positive predictive value of sinusoidal obstruction syndrome diagnosis scores
Fifteen patients (10%) fulfilled EBMT criteria for SOS diagnosis,20 but only six (4%) had a confirmed SOS diag- nosis after retrospective review of medical history (as described in the Methods section) including two late- onset SOS (Online Supplementary Table S1). The other diag- noses were liver GvHD (n=3), sepsis (n=2), cyclosporine cholestasis (n=1), HEV infection (n=1), liver GvHD with congestive heart failure (n=1), and aplastic anemia-related hepatitis with drug induced liver injury (n=1). According to the Seattle score, twenty-seven (18%) patients had cri- teria for SOS diagnosis,24 which was confirmed in only five. Twelve patients (8%) fulfilled SOS criteria according to the Baltimore score,19 including four confirmed SOS (Figure 4A and B). Median time between allo-HSCT and SOS diagnosis was 14 days (range, 6-22). Two (6%) and four (3.5%) patients with SOS received myeloablative conditioning (MAC) and RIC regimens, respectively. Three of the four SOS patients with RIC regimen ulti- mately died. Patients were followed until day+100 after allo-HSCT and no other late-onset SOS was detected. Eight patients, including the two late-onset SOS, had a supplementary ultrasound-Doppler. The higher ultra- sonography-Doppler score in patient with SOS diagnosis were 2 (n=3), and 3 (n=3, including the 2 late SOS), respec- tively. The two late-onset SOS patients had an increase of TE value at 36 kPa (vs. 12.4 kPa at baseline) and 72 kPa (vs. 5.4 kPa at baseline). No 2D-SWE was available for these two patients. Patients without SOS (n=6) had a median 2D-SWE value at 4.3 kPa and a median TE value
at 6.15 kPa. Among patients with EBMT criteria, most patients with a SOS diagnosis presented an increase of TE and 2D-SWE measures at day+7 or day+14. In four patients, increased 2D-SWE was recorded at a median of 6 days (range, 1-8) before clinical signs of SOS. 2D-SWE increased 1 day after SOS diagnosis in one patient. Among all ultrasonography, Doppler and elastography measures performed at day+7 or day+14, 2D-SWE value at day+14 was the best marker for SOS diagnosis, with a best cutoff value estimated with Youden index at 8.1 kPa (P=0.004) and a concordance index calculated at 0.84 (AUROC=0.84 [0.69-0.95]) (Figure 4C). By comparison, TE was less effi- cient (best cutoff at 8.2 kPa, AUROC=0.78 [0.61-0.91]) (Figure 4D). Ultrasonography and Doppler criteria for SOS were more frequently observed in patients with EBMT criteria but were unable to distinguish between SOS and non-SOS patients (Figure 4E). In order to determine the efficacy of the 2D-SWE measure to improve the predictive value of the current score for SOS diagnosis, we used 3x2 tables as a diagnostic tool to calculate sensibility, specifici- ty and positive predictive value of 2D-SWE combined with clinical criteria.21,25 Classical 2x2 tables (after exclu- sion of non-evaluable measures of 2D-SWE) and 3x2 tables were built to determine the diagnostic value of 2D- SWE measures (Table 3). A worse-scenario approach was calculated, where all non-evaluable measures are classified in the wrong category (absence of SOS diagnosis for patients with SOS and positive SOS diagnosis for patients without SOS). When combined with the EBMT, Baltimore or Seattle scores, a 2D-SWE value higher than 8.1 kPa improved the ability the EBMT score to efficiently diag- nose SOS, with a better sensibility (75%) and specificity (99%) for SOS diagnosis (Figure 4F). The addition of 2D- SWE improved the positive predictive value of the Seattle score from 19% to 38%, of the Baltimore score from 33% to 50% and of the EBMT score from 40% to 60%.
Discussion
After allo-HSCT, liver injury is a major cause of early mortality.3,4,23,24 Accurate and early diagnosis is the corner- stone for personalized treatment. This study presents a large real-life cohort of 146 consecutive adult patients who
2378
haematologica | 2021; 106(9)
