
Page 89 - 2021_09-Haematologica-web
P. 89
Elastography in sinusoidal obstruction syndrome
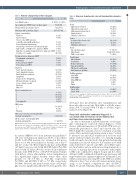
Table 1. Patients’ characteristics before transplant. Patients’ characteristics
Table 2. Allogeneic hematopoietic stem cell transplantation character- istics.
Sex (Male/Female)
Age at allogeneic HSCT (years, median, range)
Median follow-up (months, range)
Body mass index (median, range)
N=146, No. (%)
86 (59%) / 60 (41%) 53 (21-72)
9.2 (2.5-19) 24.5 (16.5-42)
Transplantation characteristics
Donor
HLA-matched-related HLA-matched-unrelated HLA-mismatched unrelated Haplo-identical
Umbilical cord blood
Source
Peripheral blood stem cells Bone marrow
Umbilical cord blood
Donor
Age (median, range) Male/Female
CMV seropositivity
Conditioning Myeloablative Sequential
Reduced intensity
Non myeloablative TBI-based conditioning Anti-thymocyte globulin
GvHD prophylaxis CSA+MTX CSA+MMF CSA+MMF+Cy CSA
Other
GvHD grading Grade II-IV Grade III-IV
N=146, No. (%)
39 (27%) 77 (53%) 5 (3%) 18 (12%) 1 (1%)
132 (90%) 13 (9%) 1 (1%)
30 (18-67)
91 (62%)/55 (38%) 70 (48%)
28 (19%) 6 (4%) 100 (68%) 12 (8%) 16 (11%) 95 (65%)
37 (25%) 82 (56%) 20 (14%) 6 (4%)
1 (1%)
61 (42%)
20 (14%)
Hepatic comorbidities
Cirrhosis
Alcohol misuse
Prior resolved HBV infection
(anti-Hbc and anti-HB antibodies)
Prior abdominal radiotherapy
Hematologic disorders-related hepatomegaly
AST or ALT > 1.5 ULN before allogeneic HSCT
Bilirubin > 2 mg/dL (34 μmol/L) before allogeneic HSCT Ferritin > 1000 ng/mL
Treatment before allogeneic HSCT Gemtuzumab ozogamycin Oxaliplatin
Prior autologous HSCT*
Prior allogeneic HSCT
Diagnosis
Acute myeloid leukemia Acute lymphoid leukemia Myelodysplastic syndrome Lymphoma
Cutaneous T-cell lymphoma Myeloproliferative neoplasm Severe aplastic anemia Myeloma
Others**
Disease risk index score 1
2
3
4 3(2%) Not applicable 13 (9%)
Missing
Fibroscan® transient elastography (kPa) (median, interquartile)
2D shear wave elastrography (kPa) (median, interquartile)
2 (1%) 6 (4%)
9 (6%) 2 (1%) 10 (7%) 6 (4%) 1 (1%) 74 (51%)
12 (8%) 5 (3%) 7 (5%) 5 (3%)
51 (35%) 12 (8%) 27 (18%) 12 (8%) 8 (5%) 20 (14%) 11 (8%) 1 (1%) 4 (3%)
10 (7%) 89 (61%) 31 (21%)
TBI: total body irradiation; GvHD: graft-versus-host disease; CSA: cyclosporin, MTX: methotrexate, MMF: mycophenolate mofetil; Cy: post transplantation cyclophos- phamide; CMV: cytomegalovirus.
developed liver involvements after transplantation and those who did not, for both TE (6.4 kPa vs. 6.0 kPa, respec- tively, P=0.71) and 2D-SWE (7.0 kPa vs. 6.8 kPa, respec- tively, P=0.71) (Figure 3B).
Sinusoidal obstruction syndrome diagnosis is associated with an increase in two-dimensional real-time shear wave elastography
In order to determine if repeated measures of elastogra- phy could improve or precede clinical diagnosis of liver disease, additional measures of TE and 2D-SWE were sys- tematically performed at day+7 and day+14 after allo- HSCT. Eight (5%) patients were not evaluable at all time points. Three patients had missing exam at day+7 related to intensice care unit (ICU) transfer (n=1) for acute renal failure (without hepatic disorder) or to missing imaging (without hepatic disorder) (n=2). Five patients had missing examination at day+14 related to ICU transfer (n=3) with early death before day+14 (one SOS, one GvHD/conges- tive heart failure and one with invasive fungal infection) or because of missing data (n=2) for patients with hepatic GvHD (one confirmed by hepatic biopsy and the others with gut GvHD confirmed with pathologic gut biopsy and improvement after immunosuppressive treatment). Liver stiffness value measured using TE or 2D-SWE was neither different at day+7 nor at day+14 between patients devel- oping or not hepatic complications after allo-HSCT (Figure 3C and D). Similarly, change in liver stiffness value
OMS status 0-1
130 (89%) 2 4(3%)
12 (8%)
5.4 (4.1-6.8)
6.0 (4.9-7.8)
HSCT: hematopoietic stem cell transplantation, HBV: hepatitis B virus, kPa: kilo Pascal; DRI: disease risk index; allo: allogeneic; OMS: ECOG Zubrod scrore; *one patient received two auto HSCT before allo-HSCT; **two chronic lymphoid leukemia, one plasmacytoid dendritic cell leukemia, one prolymphocytic leukemia.
ity criteria (IQR/M <0.3) from international guidelines16 and were excluded from analysis in 10.8% of procedures (n=45). A 2D-SWE measure was obtained in 414 proce- dures out of 432 (seven failures at baseline, six at day+7 and five at day+14). Overweight (body mass index [BMI] >29 kg/m2) was associated with 2D-SWE failure (P=0.004) but not with TE failure (P=0.21). Ascites did not influence the risk of 2D-SWE (P=0.1) or TE (P=0.09) failure. Patients with history of liver abnormalities before transplantation had significantly higher baseline values than other patients for TE (7.9 kPa vs. 5.25 kPa, respectively, P=0.0003) and 2D-SWE (9 kPa vs. 5.7 kPa, respectively, P=0.004). However, the mean baseline value of elastogra- phy was not significantly different between patients who
haematologica | 2021; 106(9)
2377
