
Page 77 - 2021_03-Haematologica-web
P. 77
Immunoprofiling and survival in DLBCL
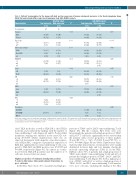
Table 2. Patients’ demographics for the groups with high and low expression of immune checkpoint molecules in the Nordic Lymphoma Group (NLG) Trial and Helsinki-diffuse large B-cell lymphoma study (HEL-DLBCL) cohorts.
NLG-Trial cohort
Low expression High expression n(%) n(%)
HEL-DLBCL cohort
Low expression High expression n(%) n(%)
P
0.016
1.000
1.000
0.209
nd 2(4)
P
0.350
<0.001
0.847
0.285
0.347
0.016
0.573
0.345
Characteristics
N. of patients
Gender
Male
Female
27
13 (48)
14 (52)
19 (70) 8 (30)
13 (50) 9 (35) 4 (15)
19
16 (84)
3 (16)
13 (68) 6 (32)
8 (53) 6 (40) 1 (7)
69
36 (52)
33 (48)
40 (58) 29 (42)
28 (41) 32 (46) 9 (13)
50
31 (62)
19 (38)
12 (24) 38 (76)
21 (42) 27 (54) 2 (4)
Age, years <60
≥60
Molecular subtypea
GCBb Non-GCB nd
WHO PS 0-1
20 (74) 7 (26)
10 (53) 9 (47)
54 (78) 15 (22)
33 (66) 15 (30)
≥2 Stage
0.632
I-II
III-IV
IPI 0-2
3-5
LDH
3 (11)
24 (89)
1 (5)
18 (95)
43 (62)
26 (38)
26 (52)
24 (48)
28 (56) 22 (44)
0.440
nd 2(3)
6 (22) 21 (78)
2 (11) 17 (89)
52 (75) 15 (22)
Low
High
nd 2(4)
3 (11) 24 (89)
2 (11) 17 (89)
35 (51) 34 (49)
21 (42) 27 (54)
1.000
ENc 0-1 ≥2
nd
Treatment
R-CHOP
R-CHOEP
Other
0.729
7 (26) 15 (56) 5 (19)
27 (100)
4 (21) 12 (63) 3 (16)
19 (100)
60 (87)
6 (9)
3 (4)
46 (92)
3 (6)
1 (2)
aMolecular subtype assessed using Hans’ algorithm. bGCB: germinal center B-cell like; EN: extranodal site; IPI: International Prognostic Index; LDH: lactate dehydrogenase; nd: not determined; PFS: progression-free survival; R-CHOP: rituximab, cyclophosphamide, doxorubicine, vincristine, prednisone; R-CHOEP: R-CHOP+etoposide. cInsufficient data con- cerning extranodal sites in the HEL-DLBCL cohort.
class I HLA molecules, as well as HLA-DR, a class II HLA molecule, and correlated the findings with the number of tumor infiltrating T cells (Figure 4A and B). Positive B2M membrane staining was enriched in the non-GCB sub- group (P=0.007) (Online Supplementary Table S3). As expected, the patients with a negative or moderate expres- sion of HLA-ABC, or negative or perinuclear expression of B2M had significantly less tumor infiltrating T cells com- pared to HLA-ABC and B2M positive cases (P=0.005 and P=0.009, respectively) (Figure 4C). In contrast, no correla- tion between HLA-DR positivity and the number of T cells was observed (data not shown).
Higher proportion of immune checkpoint positive
T cells in the tumor microenvironment translates to poor outcome
In the NLG Trial cohort, 43% of patients had high pro-
portions of TIM3+ and/or LAG3+ tumor-infiltrating T cells (Figure 5A). On the contrary, PD1 levels were low. Interestingly, the patients with a high proportion of TIM3+ and LAG3+ T cells had a significantly worse survival than the patients with a lower proportion of these markers (5-year OS 73% vs. 96%, P=0.022; 5-year PFS 74% vs. 93%, P=0.064) (Figure 5B and Online Supplementary Figure S4A). Baseline characteristics, except gender, were equally distributed between high and low immune checkpoint molecule expressing subgroups (Table 2). In the HEL- DLBCL cohort, 30% of patients had a high proportion of TIM3+ and/or LAG3+ tumor-infiltrating T cells and 42% of patients had a high proportion of TIM3+, LAG3+, and PD1+ tumor-infiltrating T cells (Figure 5C). Both a high propor- tion of TIM3+ and LAG3+ as well as a high proportion of TIM3+, LAG3+, and PD1+ tumor-infiltrating T cells translat- ed to poor outcome, validating the finding of the NLG
haematologica | 2021; 106(3)
723
