
Page 75 - 2021_03-Haematologica-web
P. 75
Immunoprofiling and survival in DLBCL
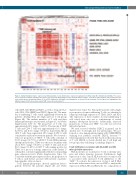
Figure 1. Digital multiplexed gene expression profiling analysis reveals distinct gene expression signatures in diffuse large B-cell lymphoma (DLBCL). The expres- sion of PanCancer Immune Profiling panel genes was assayed by Nanostring nCounter from 81 DLBCL samples. Correlation matrix analysis was performed for the most variable genes (standard deviation >1.0; n=335). Signatures with highly correlating genes are depicted in the heatmap. Selected genes are highlighted in the right-hand panel. ECM: extracellular matrix; TME: tumor microenvironment;
cells (CD8, GrB, OX40 and Ki67), as well as Tregs and Th1- cells (CD3, CD4, FOXP3 and TBET) (Figure 2A). The num- ber of infiltrating T cells varied significantly between the patients, dividing them into high and low T-cell groups (Figure 2B). The median numbers of T cells and their immunophenotypes are presented in Figure 2C and Online Supplementary Table S2. The proportion of T cells was approximately 16% (range: 0.1-69%). The amount of CD8+ T cells and CD4+ T cells was approximately 6.1% (range: 0.2-30%) and 5.4% (range: 0.0-42%), respectively. Of all CD4+ T cells, Tregs represented 15% (range: 0.2-51%) with considerable variation between the patients. We observed a very low proportion of TBET+ T cells with a median of 0.04% (range: 0.0-7.0%) of all CD4+ T cells. Of the immune checkpoint molecules, TIM3 was the most abundant with about 8.5% (range: 0.0-43%) of CD4+ T cells and about
+
5.6% (range: 0.1-69%) of CD8 T cells staining positive for
TIM3. As a proof of concept, expression of the distinct T- cell markers correlated significantly with the corresponding gene expression levels (Online Supplementary Figure S2). Consistent with the gene expression data, the proportion of T cells as such did not associate with survival or patients' demographics (data not shown).
T-cell immunophenotypes showed significant hetero- geneity between the patients (Figure 2D and Online
Supplementary Figure S3). Among the patients with a high- er proportion of tumor infiltrating T cells, we identified a subgroup with high expression of TIM3, LAG3 and PD1. The expression of these markers in tumor-infiltrating T cells varied from only one to combinations of several immune checkpoint molecules. Additionally, increased proportions of Tregs and TBET+ Th1-cells was noted in individual patients.
We next assessed whether DLBCL in general can be divided into T-cell high and low phenotypes. We per- formed in silico immunophenotyping with CIBERSORTx utilizing four publicly available DLBCL datasets.6-8,28 Clustering analyses showed that based on the proportions of T cells DLBCL is clearly divided into T-cell high and low groups, thus validating our findings (Figure 3).
T-cell infiltration correlates with HLA-ABC and β2 microglobulin expression
HLA molecules are essential for T cells to identify anti- gens and induce immune response. Furthermore, high expression of class I and II HLA molecules on tumor cells is associated with increased T-cell infiltration to the TME.10 To evaluate the expression of class I and II HLA molecules in the tumor tissue, we used IHC to analyze the expression of HLA-ABC and B2M, the two components of
haematologica | 2021; 106(3)
721
