
Page 74 - 2021_03-Haematologica-web
P. 74
M. Autio et al.
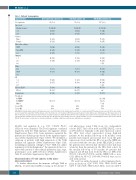
Table 1. Patients’ demographics. Characteristics
N. of patients
Age, years
Median (range) <60
≥60
Gender Male
Female
Molecular subtypea
GCBb Non-GCB nd
Gene expression cohort n (%)
81 (100)
55 (22-64) 54 (67) 27 (33)
56 (69) 25 (31)
34 (42) 26 (32) 21 (26)
48 (59)
NLG-Trial cohort n (%)
51 (100)
54 (22-64) 34 (67) 17 (33)
34 (67) 17 (33)
24 (52) 17 (37) 5 (11)
31 (61)
HEL-DLBCL cohort n (%)
137 (100)
62 (16-84) 60 (44) 77 (56)
75 (55) 62 (45)
58 (43) 66 (49) 11 (8)
98 (72)
WHO PS 0-1
≥2
33 (41)
nd 3(2)
Stage
I-II 8 (10) 5 (10) 78 (57) III-IV 73 (90) 46 (90) 58 (42) nd 1(1)
IPI
0-2 19 (23) 10 (20) 88 (64) 3-5 62 (77) 41 (80) 46 (34) nd 3(2)
20 (39)
36 (26)
Elevated LDH EN >1
B-symptoms Treatment R-CHOP
R-CHOEPh
Other 5-year PFS 5-year OS
72 (89) 45 (56)d 52 (64)
81 (100) 83%
86%
45 (88) 29 (57)e 33 (65)
51 (100) 86%
88%
73 (53)c ndf 37 (27)g
120 (88) 12 (9) 5 (4) 72% 76%
HEL-DLBCL:HelsinkidiffuselargeB-celllymphomastudycohort;NLGTrial:NordicLymphomaGroupTrial;OS:overallsurvival;PFS:progression-freesurvival.aMolecularsubtype assessed using Hans’ algorithm. bGCB: germinal center B-cell like; nd: not determined; IPI: International Prognostic Index; LDH: lactate dehydrogenase; EN: extranodal site; R- CHOP: rituximab, cyclophosphamide, doxorubicine, vincristine, prednisone; R-CHOEP: R-CHOP+etoposide. cLDH data was available from 134 patients. dEN data available from 72 patients. eEN data available from 43 patients. fInsufficient data. gB-symptoms data available from 131 patients. hPatients <65 years old with high-risk features were treated with R- CHOEP-14 and systemic central nervous system prophylaxis consisting of high-dose methotrexate and high-dose cytarabines.
ELANE; and signature B, e.g., FN1, VEGFA, PLAU, COL3A1) were identified. The B-cell signature correlated negatively with the TME immune cell signature (Online Supplementary Figure S1A). Gene signatures separated the patients into distinct groups based on the signature expres- sion (Online Supplementary Figure S1B-E). We identified a subgroup of patients with high expression of the TME immune cell signature (Online Supplementary Figure S2B), resembling an immune cell high or “hot” TME, but, unlike in primary testicular lymphoma,23 the signature did not cor- relate with survival or other clinical parameters (age, stage, performance score, LDH, EN sites) (Online Supplementary Table S1 and Online Supplementary Figure S1F).
Characterization of T-cell subsets in the tumor microenvironment
To further characterize the immune cell high TME in DLBCL, we performed mIHC focusing on the distinct T-
cell phenotypes using TMA from two independent cohorts (NLG Trial cohort n=51 and HEL-DLBCL cohort n=137) (Table 1). Similarly to the gene expression cohort, the NLG trial cohort represented young, high-risk patients. At the median follow-up of 61 months, seven patients had relapsed and six had died. As in the gene expression cohort, neither the IPI score nor the COO was associated with the outcome. In the HEL-DLBCL cohort, the patients were older but had otherwise lower risk char- acteristics than the patients in the NLG-Trial cohort. At the median follow-up of 53 months, 23 patients had relapsed and 28 had died. Both the IPI score (HR=1.82, 95%CI: 1.40-2.38; P<0.001), and the COO (GCB vs. non- GCB, HR=2.32, 95%CI: 1.08-4.99; P=0.031) were associ- ated with survival.
We used four antibody panels to detect immune check- point molecules in CD4+ (CD3, CD4, TIM3, LAG3) and CD8+ T cells (CD8, TIM3, LAG3, PD1), cytotoxic CD8+ T
720
haematologica | 2021; 106(3)
