
Page 76 - 2021_03-Haematologica-web
P. 76
M. Autio et al.
AB
C
D
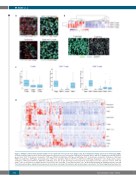
Figure 2. Multiplex immunohistochemistry (mIHC) reveals significant heterogeneity in the diffuse large B-cell lymphoma (DLBCL) tumor microenvironment (TME).
(A) Representative images from the 4-plex mIHC analyses performed on tissue microarrays (TMA) from the Helsinki diffuse large B-cell lymphoma study (HEL-DLBCL) group cohort. CD8+ T-cell immune checkpoints: CD8=cyan, TIM3=red, LAG3=blue, PD1=green, DAPI=gray. CD4+ T-cell immune checkpoints: CD3=green, CD4=cyan, TIM3=red, LAG3=blue, DAPI=gray. Cytotoxicity panel: CD8=cyan, Granzyme B=green, Ki67=red, OX40=blue, DAPI=gray. Regulatory T cells (Tregs) and Th1 panel: CD3=green, CD4=cyan, FOXP3=red, TBET=blue, DAPI=gray. Scale bar 10 μm. (B) Unsupervised hierarchical clustering based on the expression of CD3+, CD4+ and CD8+ T cells. (C) Proportions of distinct immune cells from all cells, from CD4+ T cells and from CD8+ cells. (D) Heatmap visualizing all quantified immune cells and their immunophenotypes organized by unsupervised hierarchical clustering. Full annotation with all phenotypes is provided in the Online Supplementary Figure S3.
722
haematologica | 2021; 106(3)
