
Page 78 - 2021_03-Haematologica-web
P. 78
M. Autio et al.
A
B
C
D
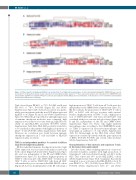
Figure 3. Diffuse large B-cell lymphoma (DLBCL) can be dived into T-cell high and low phenotypes. In silico immunophenotyping with CIBERSORTx was used to deconvolute T-cell proportions based on gene expression in four publicly available datasets.6-8,28 Gene expression datasets were uploaded to the CIBERSORTx web portal and the algorithm run using the 547-gene Leukocyte gene signature matrix (LM22) at 100 permutations. T-cell data were z-score transformed and visualized by unsupervised hierarchical clustering.
Trial cohort (5-year OS 66% vs. 79%, P=0.029, and 5-year PFS 60% vs. 76%, P=0.035) (Figure 5D and Online Supplementary Figure S4B). Survival association was partic- ularly seen in patients with the non-GCB phenotype and high IPI score (Figure 5E and F, and Online Supplementary Figure S5). When the groups with low and high expression of immune checkpoint molecules were compared, high expression was found to associate with age, high IPI score (Table 2) and HLA-ABC positivity (P=0.037) (Online Supplementary Table S4A). HLA-ABC positivity tended also to be enriched in the patients with higher proportions of LAG3+ T cells (P=0.067) (Online Supplementary Table S4B). However, no correlation was found between immune checkpoint expression in T cells and B2M or HLA-DR expression (data not shown).
TIM3 is an independent predictor for survival in diffuse large B-cell lymphoma patients
Of the individual immune checkpoint molecules, high TIM3 expression was associated with inferior survival in both cohorts (Figure 6A-D and Online Supplementary Figure S6), and was independent of the IPI and COO (Online Supplementary Figure S7). In addition, high proportions of TIM3+ T cells from all T cells, TIM3+CD4+ T cells from all CD4+ T cells, as well as TIM3+CD4+ cells from all CD4+ cells translated to poor outcome in the HEL-DLBCL cohort (Figure 6A, B, E-G), all independent of the IPI. All except a
high proportion of TIM3+ T cells from all T cells were also independent of the COO (Online Supplementary Figure S7). On the contrary, the proportions of TIM3+CD8+ T cells or PD1+ or LAG3+ cells did not associate with survival. Besides a high proportion of TIM3+ T cells, a high propor- tion of TIM3+CD4+CD3- cells from all CD4+CD3- cells correlated with poor outcome in both cohorts (Figure 6A, B and H), independent of the IPI and COO (Online Supplementary Figure S7). These cells might represent macrophages since according to the CIBERSORTx analy- sis TIM3 is expressed in monocytes/macrophages and neutrophils in addition to T cells (Online Supplementary Table S5). Interestingly, in the NLG-Trial cohort TIM3 expression correlated positively with the gene expression of IFNG (P=0.449, P=0.003) and several other cytokines (Online Supplementary Table S6).
Characterization of the cytotoxic and regulatory T cells in the tumor microenvironment
In both cohorts, when studying expression of cytotoxi- city-related markers, patients with high proportion of Granzyme B+ cells were distinct from the rest (24% in the NLG Trial cohort and 14% in the HEL-DLBCL cohort) (Online Supplementary Figure S8A). Granzyme B positivity translated to poor outcome in the HEL-DLBCL cohort (5- year OS 50% vs. 78%, P=0.029; 5-year PFS 53% vs. 72%, P=0.076) (Online Supplementary Table S7 and Online
724
haematologica | 2021; 106(3)
