
Page 142 - 2021_03-Haematologica-web
P. 142
K. Jimenez et al.
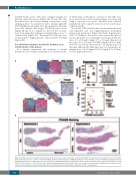
(reddish-brown areas) with areas staining strongly for platelets (navy-blue areas) (Figures 2E, 3F, and 4A). The navy-blue areas on Carstairs staining correspond to areas staining positive for platelet receptor integrin alpha-IIb (ITGA2B) (Figure 4A and B). In both experiments, thrombi from Def animals had larger ITGA2B-positive areas (Figure 4B and C) as compared to those in the Con ani- mals. Iron replacement therapy normalized these areas to control levels (Figure 4C). The larger ITGA2B areas also corresponded to higher platelet counts (r=0.537, P=0.015) (Figure 4D).
Iron deficiency enhances thrombotic tendency in an arterial model of thrombosis
In a separate experiment, the tendency to arterial thrombosis was evaluated using the ferric chloride model,
in which time to thrombotic occlusion of the right com- mon carotid artery after vascular damage was measured using a transonic flow probe. Thrombi were collected immediately after complete cessation of flow and evaluat- ed histologically.
The model of IDA and thrombocytosis remained robust and replicable, and iron supplementation normalized hematologic parameters (Figure 5A, Online Supplementary Table S3). Similar to the results of the venous thrombosis model, thrombus area and length were larger in Def rats (area: 1.5 ± 0.4 mm2; length: 3.7 ± 1.0 mm) than in Con rats (area: 0.9 ± 0.3 mm2, P=0.008; length: 2.5 ± 0.7 mm, P=0.034). Def+Fe thrombi tended to be smaller than Con thrombi, although the difference was not statistically sig- nificant (area: 1.1 ± 0.4 mm2, P=0.19; length: 2.9 ± 0.8 mm, P=0.27) (Figure 5B and C).
AC
D
B
Figure 4. Platelet area of venous thrombi is larger in iron deficiency. (A) Carstairs staining correlated with ITGA2B immunohistochemical staining for venous thrombi. Bone marrow was used as a positive control for ITGA2B. (B) Representative images of ITGA2B staining of venous thrombi. (C) Area of thrombus staining positive for ITGA2B. Experiment 1: n=9, Experiment 2: n=4-5 per group. (D) ITGA2B-positive area versus platelet count of both experiments, when both measurements were avail- able (n=3-5 per group) ***P<0.001. Error bars: mean ± standard deviation. PLT: platelet count. Con: animals fed a normal diet and given placebo injections; Def: animals fed an iron-deficient diet; Def+Fe: animals fed an iron-deficient diet and then given injections of ferric carboxymaltose.
788
haematologica | 2021; 106(3)
