
Page 144 - 2021_03-Haematologica-web
P. 144
K. Jimenez et al.
Plotting thrombus area against platelet counts again showed that higher counts corresponded with a larger resultant thrombus area (r=0.773, P<0.001) (Figure 5D) and that values in Def+Fe animals were closer to Con val- ues than those of Def animals. Interestingly, thrombus size was larger in Def rats despite the occlusion times being similar across the three groups (Figure 5E). This implies that the rate of thrombus growth was faster in Def animals.
In comparison to venous thrombi, arterial thrombi are composed predominantly of platelets (Figure 5H, Online Supplementary Figure S6A). Accordingly, thrombi from Def rats had larger ITGA2B-positive areas as compared to those from Con or Def+Fe animals (Figure 5F). As in the venous thrombosis model, the larger ITGA2B areas corre- sponded to higher platelet counts (r=0.806, P<0.001) (Figure 5G).
In summary, in models of both venous and arterial thrombosis, ID was associated with thrombocytosis and increased thrombus size. Iron replacement therapy nor- malized these parameters to approach values in control animals, underscoring the iron dependency of the pheno- type.
Iron deficiency increases coagulability and platelet activity, but impairs platelet function under shear flow
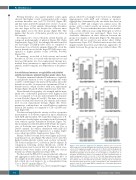
We further examined whether ID influences coagulabili- ty and platelet function in vitro, to gain insight into what could be contributing to the increased thrombus size in the thrombosis models. As in previous experiments, ID led to thrombocytosis, which resolved with iron replacement therapy (Figure 6A and B, Online Supplementary Table S3).
Upon thromboelastography, clot strength and the max- imum rate of thrombus generation were higher in Def rats as compared to Con rats and normalized in response to iron (Def+Fe) (Figure 6C and D). The time to first for- mation of fibrin was shorter in Def animals and normal- ized on iron replacement therapy (Figure 6E). These parameters combined into an overall higher coagulation index in Def animals, as compared to Con or Def+Fe ani- mals (Figure 6F).
We then evaluated platelet activity via flow cytometric measurement of P-selectin expression upon stimulation with ADP and thrombin. We found that expression of P- selectin was already higher in samples from Def animals, even without agonist stimulation (Baseline, Figure 7A). Upon stimulation with thrombin (0.25 U/mL), the expres- sion of P-selectin was greater in Def than in Con or Def+Fe animals. In contrast, stimulation with ADP (2.5 mM) increased P-selectin expression to a similar degree across all groups (Online Supplementary Figure S7A).
Plasma soluble P-selectin levels were higher in Def ani- mals than in Con ones (Figure 7B), which corroborated the higher baseline platelet activity seen on flow cytometry. The levels normalized to Con levels in Def+Fe animals. In comparison, following arterial thrombosis, soluble P- selectin levels were lower in Def rats than in Con ones, whereas levels were similar across groups after venous thrombosis (Online Supplementary Figure S7B).
We then used the PFA-100 to measure platelet adhesion and aggregation under shear flow. Interestingly, 60% of the samples from Def animals did not occlude. Those that did occlude also took longer to do so than platelets from Con or Def+Fe animals (Figure 7C).
To evaluate whether there was a defect in platelet aggre-
gation, whole blood samples were tested on a Multiplate Aggregometer with ADP and collagen as agonists. Aggregability (determined by the area under the curve) in response to ADP and collagen was similar across the groups, with a trend towards an increase in Def rats (Figure 7D). To assess whether there was a defect in adhe- sion, a static adhesion assay using fibrinogen as well as collagen-coated wells was performed. There were no observable differences in static adhesion between the groups for collagen or fibrinogen (Figure 7E). Stimulation with ADP did not result in any added effect (Online Supplementary Figure S7C). Platelet function was thus only impaired under shear flow, and otherwise appeared to be similar between the groups in assays without shear. We
AB
CD
EF
Figure 6. Iron deficiency augments clot dynamics. Animals were fed an iron- deficient diet for 7 weeks and given three injections of ferric carboxymaltose at a dose of 20 mg/kg body weight or placebo (0.9% NaCl). (A, B) Hemoglobin (A) and platelet counts (B) at the end of the experiment (n=5 per group). (C-F) Thromboelastography measurements of clot strength (C), maximum rate of thrombus generation (D), time to clot initiation (E), and coagulation Index (F) (n=4-5 per group). P<0.05, ** P<0.01, ***P<0.001. Error bars: mean ± stan- dard deviation. Con: animals fed a normal diet and given placebo injections; Def: animals fed an iron-deficient diet; Def+Fe: animals fed an iron-deficient diet and then given injections of ferric carboxymaltose; Hb: hemoglobin; PLT: platelet count; G: clot strength; MRTG: maximum rate of thrombus generation; R: time to clot initiation. .
790
haematologica | 2021; 106(3)
