
Page 141 - 2021_03-Haematologica-web
P. 141
Iron deficiency and thrombosis
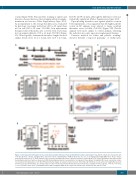
counts (Figure 3B-E). Prussian blue staining of spleen and liver also showed increased iron staining with iron supple- mentation (red arrows, Online Supplementary Figure S5A). As in experiment 1, the average thrombus area, evaluated by histology, was larger in Def rats (43.3 ± 10. mm2) than in Con rats (24.9 ± 12. mm2, P=0.032). Iron replacement therapy reduced thrombus area to levels even lower than in Con animals (Def+Fe, 19.8 ± 1.4 mm2, P=0.011) (Figure 3G). Histologically determined thrombus length showed similar trends (Con: 11.2 ± 4 mm, Def: 16.3 ± 2.3 mm,
Def+Fe: 14.58 ± 6 mm), although the differences were not statistically significant (Online Supplementary Figure S5B).
Upon plotting thrombus area against platelet count in both experiments, it was apparent that the higher platelet counts in ID animals were related to larger resultant thrombus areas (r=0.634, P=0.003) (Figure 3H). Def+Fe animals were more similar to control animals, reflecting the reduction in counts upon iron replacement therapy.
Carstairs method for fibrin and platelet staining22 showed thrombi composed primarily of erythrocytes
ABC
DEF
GH
Figure 3. Iron replacement therapy reverses iron deficiency-induced increased venous thrombotic tendency. (A) Design of experiment 2. Rats were fed an iron-defi- cient diet (Def) for 7 weeks. and given three injections of ferric carboxymaltose (FCM) at the doses of 5, 10, or 20 mg/kg body weight (BW, +Fe5, +Fe10, +Fe20, respectively) or placebo (0.9% NaCl). Animals fed a control diet and given injections of placebo formed the control group (Con). Venous thrombosis was induced after hematologic parameters had been measured. (B-E) Hematologic parameters measured prior to surgery (n=4 per group): hemoglobin (B), mean corpuscular volume (C), hematocrit (D) and platelet count (E). (F) Representative images of Carstairs-stained sections of thrombi. (G) Thrombus area measured on longitudinal sections (n=4-5 per group). (H) Thrombus area versus platelet counts of both experiments, when both measurements were available (n=3-5 per group). *P<0.05, **P<0.01, ***P<0.001. Error bars: mean ± standard deviation. Hb: hemoglobin; MCV: mean corpuscular volume; HCT: hematocrit, PLT: platelet count.
haematologica | 2021; 106(3)
787
