
Page 144 - 2021_02-Haematologica-web
P. 144
P.J. Hohensinner et al.
RNA derived from the extracellular vesicle fraction was highest in vesicles derived from M(IL-4+IL-13) (Figure 5C). This was not, however, due to increased individual loading of extracellular vesicles with RNA, as the percentage of RNA+ extracellular vesicles was similar, at around 45%, for all polarization conditions: M0, M(IL-4+IL-13) and M(LPS+IFN-γ) (Online Supplementary Figure S2A).
pSTAT6+ macrophages were found within tumor tissue (Online Supplementary Figure S2B). Staining for TF and the macrophage marker CD206 also revealed macrophages
positive for TF (Figure 6A). Not only did cells stain posi- tive for TF but so too did the intracellular space (Figure 6B). These positive streaks of TF also stained positive for specks of CD206, which might indicate macrophage- derived extracellular vesicles. To understand a possible link between TF+ areas and areas positive for CD206 we evaluated tumor tissue from different human donors. At least seven sections from each tumor were scored for the presence of CD206 or TF. We found that especially regions with high TF expression also showed strong
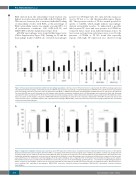
ABC
Figure 3. Tissue factor protein induction in different macrophage populations. (A) Tissue factor (TF) protein levels in supernatants from M0 macrophages generated via stimulation with macrophage colony-stimulation factor (MCSF) or granulocyte-macrophage colony-stimulating factor (GMCSF) (n=6). (B) TF protein in supernatants from macrophages that were generated either by stimulation with MCSF or GMCSF and polarized into M(LPS+IFN) and M(IL-4+IL-13) as indicated in the Methods. The respective M0 was used to determine the fold changes induced by the polarization conditions (n=6). (C) Macrophages were polarized for 48 h and afterwards repolarized for 24 h as indicated (n=5). TF protein levels were determined using a specific enzyme-linked immunosorbent assay as indicated in the Methods section. Values are given as fold changes compared to MCSF-differentiated macrophages in panel (A) or the respective unpolarized control (M0) in panels (B) and (C) and represent mean values ± standard deviation. M0: unpolarized macrophages; M(LPS+IFNγ): classically activated polarized macrophages; M(IL-4+IL13): alternatively activated polarized macrophages.
ABC
Figure 4. Epigenetic regulation of tissue factor. (A) Tissue factor (TF) expression on the surface of human monocytes cultured for 24 h in the presence of 100 ng/mL lipopolysaccharide (LPS) and 100 ng/mL interferon (IFN)-γ or 20 ng/mL interleukin (IL)-4 and 20 ng/mL IL-13 or without any addition (control) was analyzed by flow cytometry using a specific antibody as described in the Methods. Data are shown as mean fluorescence intensity (MFI) (n=4). (B) Methylation of the TF-promoter was analyzed by quantitative polymerase chain reaction as indicated in the Methods section. Macrophage values are given as fold increases compared to the monocyte value, which was set at 1. Monocytes and macrophages from the same individuals were compared (n=4). (C) TF protein was determined using a specific enzyme- linked immunosorbent assay as indicated in the Methods section in the presence of the demethylating agent RG108 at a concentration of 5 mM during polarization. Values are given as fold changes compared to the respective unpolarized control (M0) (n=3) and represent mean values ± standard deviation. MFI: mean fluores- cence intensity; M0: unpolarized macrophages; M(LPS+IFN): classically activated polarized macrophages; M(IL-4+IL13): alternatively activated polarized macrophages.
458
haematologica | 2021; 106(2)
