
Page 67 - 2020_09-Haematologica-web
P. 67
XPO1 is a target to treat β-thalassemia
A
B
C
D
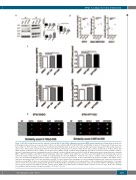
Figure 3. KPT-251 treatment increases the amount of nuclear HSP70 and GATA-1 in β-thalassemia major (β-TM) erythroid progenitors. Erythroblasts derived from β-TM peripheral blood cells were treated at day 4 of CD36+ cell culture with 100nM, 1000nM of KPT-251, or with DMSO (control) for 72 hours (H). All data were ana- lyzed at day 7 of CD36+cell culture (72 hours of treatment). (A) Immunoblot from 10 μg of nuclear extracts (NE) and 30 μg of cytoplasmic extracts (CE), (represen- tative of three independent experiments performed on two different β-TM patient cell cultures). Graph shows optical relative quantity values of XPO1, HSP70 and GATA1 proteins normalized to that of HSP90 for CE and to that of HDAC2 for NE. Conditions KPT 100nM and 1000nM are normalized to that of DMSO condition. Absence of cytoplasmic proteins contamination in nuclear extracts is evidenced by the absence of HSP90 in NE. (B) Graph shows nuclear mean fluoresence intensity (MFI) of HSP70 and GATA-1, and HSP70 nuclear/cytoplasmic (N/C) ratio of MFI in treated (KPT 100 and 1000) and control (DMSO) cells determined by confocal microscopy images analyses. Data are presented as mean±standard error of mean (SEM) (for a minimum of 30 cells per condition), and are normalized on area. P- values are determined by ANOVA Dunnett’s multiple comparison test. Data are representative of three independent experiments. (C) HSP70 and GATA-1 nuclear expression (mean pixel), HSP70 N/C ratio (mean pixel) and HSP70 nuclear translocation (similarity score) were analyzed by ImageStream. Data are presented in his- tograms as mean±SEM. P-values are determined by ANOVA Dunnett’s multiple comparison test (representative of three independent experiments). On average, 30,000 events were collected in all experiments. (D) Three illustrating images of ImageStream experiments. Cells were probed for HSP70 and GATA-1 expression and run on the ImageStream. Bright field (white), HSP70 (green), GATA-1 (red), DAPI (purple) and HSP70/DAPI composite (scale bar=7μm). Respective similarity score±SEM are indicated under each group of images. *P<0.05; **P<0.01.
haematologica | 2020; 105(9)
2245
