
Page 66 - 2020_09-Haematologica-web
P. 66
F. Guillem et al.
AB
CD
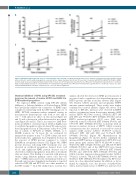
Figure 2. KPT-251 treatment has low effect on cell proliferation and cell death. Cell death and proliferation curves analysis of β-thalassemia major (β-TM) (A and B) and cord blood (C and D) erythroid progenitors, assessed by blue trypan staining at 24, 48 and 72 hours (H) of treatment with KPT100nM, KPT1000nM, or DMSO (control). Daily mean percentage±standard deviation (SD) of dead cells (n=5 independent experiments for β-TM and n=3 independent experiments for cord blood). Daily mean±standard deviation of cell proliferation (n=6 independent experiments for β-TM and n=3 independent experiments for cord blood). P-values are deter- mined by ANOVA Dunnett’s multiple comparison test **P<0.01, NS: not significant.
Chemical inhibition of XPO1 using KPT-251 treatment increases the amount of nuclear HSP70 and GATA-1 in β-TM erythroid progenitors
We repressed XPO1 activity using KPT-251 (Merck Millipore), a Selective Inhibitor of Nuclear Export (SINE) that specifically inhibits the formation of XPO1-cargo complex by interacting with the NES binding-groove of XPO1. KPT-251 treatment induces minimal toxicity in non-cancerous hematopoietic cells both in vitro and in vivo,15-19 with almost no effect on cell survival (Figure 2A and C) and a decrease in cell proliferation but not signifi- cant (Figure 2B and D). This is in contrast to LMB treat- ment, an inhibitor of nuclear export which is highly toxic for erythroid progenitors (data not shown).We exposed ery- throid progenitors from β-TM patients, at day 4 of CD36+ day of culture, to KPT-251 at 100nM, 1000nM, or to DMSO (control) for 72 hours (h). As evidenced by immunoblot analyses at day 7 of CD36+ culture, the treat- ment resulted in a significant dose-dependent decrease in the amount of XPO1 protein compared to control (DMSO) in cytoplasmic extracts (CE) (Figure 3A). XPO1 protein decrease following KPT treatment was also observed in erythroid progenitors derived from cord blood, and significant XPO1 protein decrease can be observed in erythroid progenitors from 24 h of treatment (data not shown). This finding is consistent with previous studies using different primary cancer cells and cell lines.20,21 XPO1 repression by the treatment probably acts through a proteasome-dependent mechanism as reported earlier for KPT-185 and KPT-330, two other members of the KPT family.22,23 In β-TM erythroblasts, western blot
analysis showed the decrease in XPO1 protein amount is associated with a significant dose-dependent increase in HSP70 protein amount in nuclear extracts (NE) (Figure 3A). Nuclear GATA1 amounts and cytoplasmic HSP70 amounts remain unchanged. These results were further confirmed by confocal analyses (Figure 3B); after a 72-h exposure to KPT-251, increases were observed in HSP70 nuclear concentration [mean fluorescence intensity (MFI) nuclear HSP70 48.27±4.6 (control), 58.85±5.2 (KPT 100 nM) (NS) and 79.06±9.0 (KPT 1000nM) (P<0.01)] and in HSP70 nuclear/cytoplasmic (N/C) ratio [MFI ratio 0.24±0.02 (control), 0.35±0.02 (KPT 100nM) (P<0.01) and 0.37±0.03 (KPT 1000nM) (P<0.01)]. Consistent with an increase in nuclear location of HSP70, GATA-1 nuclear concentration was also increased as assessed by confocal analyses [MFI nuclear GATA-1 48.53±5.9 (control), 44.32±2.9 (KPT 100 nM) (NS) and 74.17±2.8 (KPT 1000nM) (P<0.01)] (Figure 3B). Quantification by ImageStream (Figure 3C and D) further confirmed the increase in HSP70 nuclear accumulation by KPT-251 treat- ment [mean pixel nuclear HSP70 95.22±0.40 (control), 98.27±0.36 (KPT 100nM) (P<0.01) and 108.2±0.38 (KPT 1000nM) (P<0.01)], and of the HSP70 N/C ratio [mean pixel ratio 1.551±0.02 (control), 1.654±0.02 (KPT 100nM) (P<0.01) and 1.647±0.02 (KPT 1000nM) (P<0.01)] and GATA-1 nuclear expression [mean pixel nuclear GATA-1 730.2±2.1 (control), 756.2±2.2 (KPT100nM) (P<0.01) and 816.5±2.1 (KPT 1000nM) (P<0.01)] induced by KPT treat- ment, in a dose-dependent manner. In addition, as deter- mined by similarity score, the fraction of erythroblasts with a nuclear translocation of HSP70 was increased fol-
2244
haematologica | 2020; 105(9)
