
Page 68 - 2020_09-Haematologica-web
P. 68
F. Guillem et al.
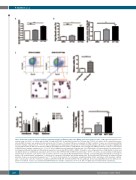
AB
C
DE
Figure 4. KPT-251 treatment improves terminal erythroid maturation in β-thalassemia major (β-TM) erythroid progenitors in vitro. β-TM erythroid progenitors were treated at day 4 of CD36+ cell culture with 100nM, 1000nM of KPT-251, or with DMSO (control) for 72 hours (day 7 CD36+ cell culture). (A) The mean fluorescence intensity (MFI) of Band 3 was analyzed by flow cytometry after 72 hours of treatment. MFI were normalized on DMSO condition. P-values are determined by ANOVA Dunnett’s multiple comparison test **P<0.01, NS: not significant (n=8 independent experiments, n=3 different β-TM samples). (B) (Left) Percentage of high Band3 cell population under the different treatment conditions and (Right) absolute number of high Band3 cells, normalized to DMSO treatment. P-values are determined by ANOVA Dunn’s multiple comparison test, **P<0.01, NS: not significant, n=8 independent experiments, n=3 β-TM patients. (C) Representative flow cytometry plots (a4-integrin and Band3 staining) of β-TM erythroid progenitors treated with KPT1000nM or DMSO. Strategy for cell sorting purification of high Band3 (red box) and low Band3 (blue box) erythroblasts populations after 72 hours (H) of KPT1000nM or DMSO treatment (day 7 CD36+ cell culture). A representative morphological analysis (x25 oil objective, scale bar= 10 μm) of purified cells from each gate by May-Grünwald-Giemsa staining. Corresponding graph showing the percentage of mature cells (orthochromatic erythroblasts + reticulocytes) contained in low Band3 and in high Band3 gates (n=3 independent experiments, n=2 different β-TM patients). P-values are determined by paired t-test ***P<0.001. (D) Proportions (%) of immature, polychromatophilic (PolyC), and mature (orthochromatic erythrob- lasts + reticulocytes) cells after 72 hours of treatment with KPT100nM, KPT 1000nM or DMSO. NS: not significant. (E) Corresponding TM index for the different con- ditions of treatment. P values are determined by ANOVA Dunnett’s multiple comparison test *P<0.05, NS: not significant (n=5 independent experiments).
2246
haematologica | 2020; 105(9)
