
Page 94 - Haematologica-April 2018
P. 94
P.B. Sinclair et al.
able for all except patient 4. A core of three to 16 concor- dant CNA, involving coding gene regions, were clonal at presentation and retained in all xenografts (Online Supplementary Table S7). The existence of competing sub- clones and branching genomic evolution was demonstrat- ed by discordant CNA, which occurred at a rate of
between four and 12 (Figure 3 and Online Supplementary Table S7). Clonal trisomies or copy number neutral loss of heterozygosity, present in each patients’ sample, were lost after transplantation, while deletions and amplifications were typically sub-clonal and either lost or increased in level or newly emergent as sub-clones in xenografts.
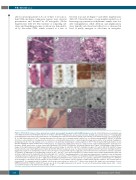
ABC
D
E
FG
Figure 2. Histological sections of bone marrow from controls and xenografts transplanted with SLIEW transduced cells. (A) Control NSG mouse: hematoxylin and eosin (H&E) stained femur showing heterogeneous cell types, abundant megakaryocytes and vascular structures. (B) H&E stained femur from 4aSLIEW showing tightly packed homogeneously stained cells and an absence of megakaryocytes and vascular structures (image representative of six animals showing only morphology type A). (C) H&E stained femur from 3bSLIEW showing heterogeneous cell types but in comparison with controls, loss of cellularity and organization, absence of vascular structures, reduced numbers of megakaryocytes and presence of small darkly stained cells or cellular fragments (image representative of two animals showing mor- phology type B). (D) The only example seen of co-existence of A and B type morphology in a sternal segment of 3bSLIEW: first left panel; H&E stained whole section with box marking the region shown in the second left panel. Second left panel; H&E stained detail of a single sternum segment displaying both A and B type mor- phologies. Middle panel; whole sections stained with anti-human CD19 and Ki-67 antibodies, arrowheads indicate three regions corresponding to high resolution images in the right hand panels. Right hand panels; high resolution images of anti-CD19 and Ki-67 staining from regions 1, 2 and 3. Anti-CD19 and Ki67 stained human leukemia cells remain tightly packed (region 2) with little diffusion to adjacent areas of acellular marrow (region 3). Anti-Ki67 and CD19 staining demonstrat- ing that the proportion of cycling human cells are reduced in region 2 compared with region 1 suggesting a microenvironment less favorable for leukemia cell growth. (E) Examples of TEM images of xenograft tibia sections. In 4aSLIEW and 1aSLIEW cells appear homogeneous compared with controls (Online Supplementary Figure S6) and have a high nuclear to cytoplasmic ratio (VL morphology). 3aSLIEW and 2aSLIEW displaying evidence of cell death and characteristics of apoptosis, such as chromatin clumping and nuclear fragmentation (AP morphology). Images are representative of four animals each showing VL and AP morphology. (F) Examples of skull and brain sections from 3bSLIEW (left panel) and 1bSLIEW (right panel) showing heavy infiltration of the calvaria in both cases (arrow 1), light (3bSLIEW) and heavy (1bSLIEW ) infiltration of the meninges, respectively (arrow 2). Images are representative of seven animals. (G) Two examples of H&E stained patients’ trephines. The left hand panel is from patient 1 for comparison with the leukemia cells from the same patient in a mouse (1aSLIEW) tibia section shown in (B). Images are representative of seven iAMP21-ALL patients’ trephines analyzed. Scale bars are; (A, B, C) two right hand panels of (D and G) - 50 mm, far left hand and two middle panels of (D) – 1 mm, second from left panel of (D and F) 200 mm and (E) - 10 mm.
638
haematologica | 2018; 103(4)
