
Page 96 - Haematologica-April 2018
P. 96
P.B. Sinclair et al. A
B
C
D
E
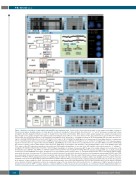
Figure 3. Analysis of evolution of copy number abnormalities in xenograft models. Panels in blue boxes show heat maps of copy number from SNP6.0 arrays for chromosomal regions showing evidence of clonal genomic evolution in xenografts, P (presentation), R (remission), 1°,2° and 3° (primary, secondary and tertiary xenografts). Box-flow diagrams illustrate loss, gain or change in level of genomic abnormalities. White boxes; sample analyzed, gray boxes; sample not analyzed, red type; CN gain of one, purple; CN gain of two, light red; sub-clonal CN gain, black; CN loss of one, blue; CN loss of two, gray; subclonal loss, green CN-LOH. * indicates deletion was detected by whole genome sequencing but not by SNP6.0 array. (A) Patient 1 – including heat maps of 9p demonstrating gain of bi-allelic deletion of a region containing CDKN2A/B and focal mono-allelic deletion of a region of 3p containing the CMTM genes 6-8. Chromosome 21 heat maps illustrate a complex pat- tern of copy number gain and loss characteristic of iAMP21 and also demonstrate additional CN changes in one 2° and all 3° xenografts. The color-coded bar depicts regions of chromosome loss or gain in the derivative iAMP21, [der(iAMP21)]. Green box; chromosome 21 CN profiles before and after iAMP21 evolution and showing the position of probes used for FISH analysis. Upper black box; FISH image of metaphase and interphase cells showing multiple copies of the RUNX1 region and three copies of the APP region at presentation. Lower black box; FISH images showing three or one copy of the APP region in cells from the patient, a 1° and two 2° xenografts. (B) CNA discordant between patient 2 and xenografts including; loss of whole chromosome (WC) X, gain of an iso(Xp) and gain of a focal deletion of Xp involving the genes ZNF157 and ZNF41. (C) CNA discordant between patient 3 and xenografts including different deletions involving ETV6 one of which potentially resulted in a novel ETV6-BICD1 fusion gene. (D) Differences in copy number profiles between three 1° xenografts from patient 4. These included two different large mono-allelic deletions of chromosome 10 (1 and 2) both of which contained a focal bi-allelic deletion (3), present in all xenografts and involving PIK3AP1 and LCOR. A second bi-allelic deletion (4) was present in two xenografts only and involved BLNK. Other discordant CNA included complex rearrangements of 17q and 14q, focal deletions of 4q34.1, 16p13 and 22q13.1 and a focal amplification of 4q13.2. E. Sub-clonal deletions at 2p25.1, 3q13.3 and 12q24.1 present in patient 5 became dominant clones in the xenograft while a sub-clonal deletion of 3p21.3 was lost and sub-clonal deletions of 1q42.3 and 5q33.3 (marked by red arrow 1) were gained. In the patients’ relapse sample the 3p21.3 deletion became dominant while other sub-clonal abnormalities detected at presentation were lost. As with the xenograft a focal deletion of 5q33.1 (marked by red arrow 2) emerged at relapse. The two 5q deletions both resulted in loss of coding exons of EBF1. Genomic positions of breakpoints derived from SNP6.0 analysis and genes contained within focal CNA, for all patients and xenografts, are annotated in Online Supplementary Table S7.
640
haematologica | 2018; 103(4)
