
Page 93 - Haematologica-April 2018
P. 93
iAMP21 xenografts
1 and Online Supplementary Table S4). Serial three-dimen- sional reconstructions of one xenograft showed dramatic increases in signals from the spleen and head between weeks 11-15 (Figure 1D).
Morphology and ultrastructure of bone marrow and cen- tral nervous system reveals patient-specific heterogene- ity, including evidence for systemic bone marrow niche destruction
To investigate bone marrow morphology and central nervous system (CNS) involvement in the iAMP21-ALL models, we examined sections through tibiae, sterna and heads of the mice engrafted with SLIEW-transduced cells. Control NSG bone marrow stained with hematoxylin and eosin resembled that of a wild-type mouse23 and was neg- ative for anti-human CD19, CD45 and Ki-67 staining (Figure 2A and Online Supplementary Figure S4). In xenografts, two types of morphology were seen, both of which differed from controls; type A, which closely resem- bled that of iAMP21-ALL patients’ trephines (Figure 2B,G, Online Supplementary Figures S4 and S5 and Online Supplementary Table S2) and type B, which although abnor- mal, clearly differed from the patients’ trephines (Figure 2C,G and Online Supplementary Figure S4). Cells in type A but not type B sections were actively cycling and of human origin as indicated by staining with anti-human Ki67, CD19 and CD45 antibodies (Figure 2D and Online Supplementary Figure S4). Individual sections presented with either type A or B morphology only with the excep- tion of one sternal segment in which both types co-existed (Figure 2D). There was relatively sharp demarcation between the A and B type areas, suggesting that the iAMP21 ALL cells were organized into massive clumps that did not diffuse easily within the lumen.
We performed transmission electron microscopy of decalcified sections of different tibiae or forelimb bones from each mouse. Xenograft ultrastructure always differed from that of wild-type controls and, as with bright field microscopy, two distinct categories could be identified (Figure 2E and Online Supplementary Figure S6). The first was termed viable leukemia (VL), as mitotic figures were present and cells appeared normal, although homogeneous by comparison with controls. There were more connec- tions and less extracellular space between cells in prepara- tions from 4a/bSLIEW compared with controls and 1a/bSLIEW.
The second category, equivalent to histological type B, was termed apoptotic (AP), as no mitotic figures were present and cells were depleted in number with classical signs of apoptosis, in the form of condensed chromatin localized to the periphery of the nucleus.24
We also examined sections through the skulls and CNS of seven of the eight xenografts (Figure 2F and Online Supplementary Figure S7), revealing calvaria in all cases, packed with homogeneously stained cells resembling the A type morphology of tibial sections. CNS involvement ranged from small foci of leukemia cells to heavy meningeal infiltration, extending into the choroid plexus in one case. Comparison of CNS histological grades for each xenograft with bone marrow histopathology and transmis- sion electron microscopy data (Table 2) showed heavy CNS involvement only in 1a/bSLIEW and 4a/bSLIEW, correlating with tibia marrow histological type A and transmission electron microscopy type VL. We infer the proportion of transduced cells infiltrating the CNS varied between mice because luminescent signals from the head failed to corre- late with histological grade (Table 2).
To investigate the relative incidence of the morphologi- cal types we examined bone marrow sections, stained with hematoxylin and eosin and anti-CD19, from 13 addi- tional xenografts derived from seven B-ALL patients (Online Supplementary Tables S3 and S6). Among these cases, type B morphology was seen in two primografts, one derived from a relapsed iAMP21-ALL patient and the second from a case with high hyperdiploid ALL; areas of A type morphology were also seen in both (Online Supplementary Figure S8). Other xenografts displayed A type morphology either exclusively (Online Supplementary Figure S9) or infiltrating apparently normal mouse bone marrow (Online Supplementary Figure S10). Interestingly these latter cases supported our initial observation that the ALL cells may grow in clumps because CD19-positive cells formed distinct clusters.
Segregation of copy number abnormalities in xenografts implicates known and novel genes in the progression of acute lymphoblastic leukemia with intrachromosomal amplification of chromosome 21
We used SNP6.0 array profiles to evaluate the genomic stability of iAMP21-ALL in 21 xenografts from five patients. Presentation and remission samples were avail-
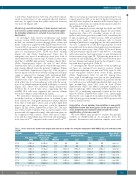
Table 1. In-vivo and ex-vivo luminescent imaging data and spleen weights for xenografts transplanted with iAMP21-ALL cells transduced with pSLIEW.
Xenograft
Whole Body Luminescence (photons/second)
Dissected Organ Luminescence (photons/second)
Spleen weight/ % GFP +ve blasts*
0.83g / 0.2
0.81g / 0.0 0.23g / 44 0.27g / 68% 0.53g / 1.6% 0.88g / 0.8% 0.40g / 24% 0.55g / 26%
Peak whole body (PWB)
Peak injected femur (PIF)
2.53E+08
5.09E+07
1.90E+08
4.00E+08
2.44E+07
1.43E+07
1.06E+08
3.64E+08
Ratio PWB/PIF
2.72
5.84 8.63 4.53 15.53 10.83 31.13 10.03
Spleen
ND
Liver
ND
Kidney (mean)
ND
Spleen radiance/g
ND
4SLIEWa 6.87E+08
4SLIEWb 2.97E+08
3SLIEWa 1.64E+09
3SLIEWb 1.81E+09
1SLIEWa 3.79E+08
1SLIEWb 1.57E+08
2SLIEWa 3.30E+09
2SLIEWb 3.65E+09
ND ND ND ND 5.69E+08 3.77E+07 1.49E+05 2.47E+09
3.85E+08 1.99E+07 3.02E+05 1.43E+09 1.12E+07 4.10E+06 2.50E+05 2.11E+07
2.60E+07 1.04E+09 3.10E+09
4.27E+06 9.84E+07 1.83E+08
1.84E+05 3.67E+05 6.65E+05
2.95E+07 2.60E+09 5.64E+09
*blasts are CD19-positive cells isolated from spleen.
haematologica | 2018; 103(4)
637
