
Page 92 - Haematologica-April 2018
P. 92
P.B. Sinclair et al.
all were assigned unique identifiers indicating passage number and patient of origin, for example 2°3e was one of several secondary xenografts derived from patient 3. Xenograft leukemia cells constituted between 40-92% of bone marrow and 23-53% and 79-99% of crude and puri- fied spleen samples, respectively (Online Supplementary Table S4). Essentially all human cells isolated from xenografts expressed the B-cell markers CD19 and CD10 but analysis of CD34 and CD38 demonstrated consider- able phenotypic divergence between mice (Online Supplementary Table S5 and Online Supplementary Figure S1).
To investigate their potential for use in in-vivo and in- vitro functional studies, we transduced xenograft stocks from four iAMP21-ALL patients with the pSLIEW lentivirus vector that expresses luciferase and enhanced green fluorescent protein (EGFP).22 Three days after trans- duction, a total of 3x10⁶ cells from each patient were transplanted by intra-femoral injection into two NSG
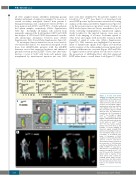
mice each, here identified by the patients’ number fol- lowed by aSLIEW or bSLIEW. Less than 1% of transduced cells were EGFP-positive by fluorescence-activated cell sorting analysis at this time point (Online Supplementary Figure S2) or by fluorescence microscopy after 1 week of culture on MS-5 feeder layers (data not shown); nevertheless, by 2-4 weeks following transplantation, luminescent signals, clearly localized to the injected femora, were seen on whole body imaging of all mice. Leukemia spread to other bones and organs with noticeable variation in the strength of signal at some sites (Online Supplementary Figure S3). This variation was highlighted by measure- ment of luminescent signals from organs post-mortem and by analysis of the relationship between signal devel- opment at different sites over time (Figure 1A,B and Table 1). Signal variation in the spleen was shown to relate to the proportion of infiltrating blast cells that expressed EGFP rather than to overall tumor load (Figure 1C, Table
A
B
C
Figure 1. In xivo and ex-vivo imaging of xenografts. (A) Serial quantification of the luminescent signal from injected and con- tralateral femora and the whole body for each xenograft suggest- ing variations in the rate at which cells migrate from the site of injection and the degree to which different sites are infiltrated by transduced cells. For example, in 3a/bSLIEW the strength of signal from the contralateral femur lagged substantially behind that of the injected femur until weeks 10-13, while in 1a/bSLIEW and 2bSLIEW the two femora showed similar levels from week 2. (B) Example of ex-vivo imaging of dissected organs showing total luminescent readings for spleen, liver and kidney. Images are rep- resentative of six animals ana- lyzed. (C) Examples of FACS analysis of cells isolated from the spleens of 3aSLIEW and 4aSLIEW, demonstrate marked contrast in the proportion of CD19-positive cells that are EGFP-positive. (D) A single example of serial three- dimensional reconstructions of luminescent signals in 2aSLIEW, 11 and 15 weeks after transplant. Arrows point to regions of the skull, spleen and a third site showing strong signal increase between these two time points. The skeleton projected for orien- tation is not derived from this animal.
D
636
haematologica | 2018; 103(4)
