
Page 189 - Haematologica-April 2018
P. 189
SR-AI contributes to VWF clearance
lution analysis revealed that VWF co-localized with SR-AI on these cells (Figure 3E). Moreover, we also observed VWF present in EEA-1-containing endosomes (Figure 3F), indicating that SR-AI binding is followed by uptake and delivery to the lysosomal degradation pathway. Duolink- PLA analysis was performed to further confirm that VWF associates with SR-AI. This analysis revealed numerous red spots when VWF was incubated with SR-AI-express- ing HEK293 cells, whereas such spots were absent upon incubation with non-transfected cells or when VWF was omitted from the incubation (Figure 3G-J). A similar co- localization between VWF and SR-AI was observed when testing the binding of VWF to THP1-macrophages (Figure 3K-L). Furthermore, binding to THP1-derived
AB
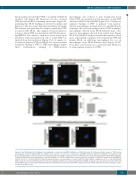
macrophages was reduced to near background levels when VWF was incubated in the presence of anti-VWF antibodies Mab723 and Mab540 (Figure 4A-C). Finally, we analyzed binding of VWF to primary bone marrow- derived macrophages obtained from wt- and SR-AI-defi- cient mice. We observed strongly reduced VWF staining to macrophages derived from SR-AI-deficient mice com- pared to macrophages derived from control mice (Figure 4D-F). Duolink-PLA analysis revealed the formation of red spots, representing complexes between human VWF and murine SR-AI on wild-type macrophages but not on macrophages from SR-AI-deficient mice (Figure 4G,H). From these observations it is conceivable that SR-AI acts as a macrophage-receptor for VWF.
C
DEF
GH
Figure 4. van Willebrand factor binding to macrophages is reduced by anti-VWF antibodies or SR-AI deficiency. (A, B) Representative images of THP1-derived macrophages incubated with pd-VWF (10 mg/mL) in the absence or presence or monoclonal anti-VWF antibodies Mab723 & Mab540 (167 mg/mL). (D,E) Representative images of murine CD115+ bone marrow-derived macrophages obtained from wt- or SR-AI-deficient mice that were incubated with pd-VWF (10 mg/mL). Cell-bound VWF was probed using polyclonal anti-VWF antibodies. (C and F) Quantification of immune fluorescent signals for VWF. Data represent mean±SEM [(n= 64-120 cells (C); n= 62-118 cells (F)]. Statistical analysis involved a one-way analysis of variance with the Tukey multiple comparison test (C) or a two-tailed Mann- Whitney test (F). (G, H) wt and SR-AI-deficient murine-macrophages (CD115+) were incubated with human pd-VWF (10 mg/mL). Association between murine-SR-AI and human-VWF was detected using Duolink-PLA analysis by combining monoclonal anti-human-VWF and goat anti-murine-SR-AI antibodies. All microscopy figures: objec- tive 40x, scale bars 10 mm.
haematologica | 2018; 103(4)
733
