
Page 149 - Haematologica-April 2018
P. 149
TNF receptor signaling as therapeutic target in CLL
ABC
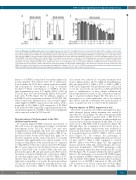
Figure 4. TNF-α-induced NFκB activity in CLL cells is inhibited by wogonin. (A) 2 x 10⁷ CLL PBMC (n=3) were treated with 100 ng/mL TNF-α or PBS as control in 400 mL complete medium with or without TNF-α-blocking antibody (15 mg/mL). After 30 min, NFκB activity was assessed via an oligo-based chemiluminescence ELISA that detects binding of p65 to NFκB consensus binding sequence (wt), and was normalized to p65 background binding to a mutated oligo (wt – mut). Mean values and respective SEMs are depicted relative to PBS control. Paired Student's t-test was applied for significance analysis (**P=0.001). (B) NFκB activity in 1 x 10⁷ CLL- derived PBMC (n=2) upon addition of 100 ng/mL TNF-α for 30 minutes in the presence or absence of 50 mM wogonin was assessed as described in (A). Results are depicted as mean values and SEMs relative to DMSO control (1%). (C) A total of 4 x 10⁵ CLL PBMC were cultured for 1 day in 200 mL complete medium in 96- well plates. On day 2, wogonin and TNF-α were added either alone, or in combination, at the concentrations indicated. 1% DMSO was used as untreated control. Cell survival was assessed after a further 24 h via flow cytometry by gating on annexin V-PE/7-AAD-negative cells. Results are depicted as mean survival rates and SEM of 5-8 samples. Paired Student's t-test was applied for significance analysis (*P<0.05; **P<0.01). PBS: phosphate buffered saline; wt: wild-type; mut: mutated; DMSO: dimethyl sulfoxide; NFκB: nuclear factor κ-light-chain-enhancer of activated B cells; TNF-α: tumor necrosis factor-α.
increase of sTNFR-1 serum levels was further induced in young syngeneic WT animals after AT of splenocytes from leukemic Em-TCL1 mice, which resulted in reliable and homogeneous development of CLL as formerly described.25,28 Mean concentrations of sTNFR-1 42 days after transplantation were 2.79 ng/mL (SEM ± 0.23) in TCL1 AT mice (n=7) and 2.04 ng/mL (SEM ± 0.23) in WT mice (n=6; P=0.04; Figure 5A). In addition, analysis of mTNFR-1 by flow cytometry in murine CD19+CD5+ CLL cells isolated from different tissue sites revealed signifi- cantly higher mTNFR-1 expression in the spleen, with a mean MFI of 3.53 (SEM ± 0.28) compared to 1.84 (SEM 0.28) in PB (P<0.001; Figure 5B), suggesting that microen- vironmental regulation of TNFR-1 expression in malignant cells is mirrored in the Em-TCL1 model.
cell content was reduced by wogonin treatment from 31.14% (SEM ± 5.63) to 18.79% (SEM ± 5.99) in PB (Figure 6D), and from 56.31% (SEM ± 6.78) to 32.55% (SEM ± 10.67) in PC (Figure 6E). The proliferation rate of CLL cells in vivo was assessed by i.p. injection of 200 mg EdU 20 h prior to euthanization of mice, which confirmed the reduced proliferative activity of CLL cells in mice respond- ing to wogonin treatment (Figure 6F). The data was too heterogeneous to reach significance, due to two animals that did not respond to treatment. But in the majority of mice, wogonin was able to control CLL development.
Wogonin impacts on TNFR-1 expression in vivo
The effect of wogonin was further investigated in mice with advanced disease where treatment was started 21 days after AT of CLL (Figure 7A). Mice were gavaged daily with either 40 mg/kg/d wogonin (n=5) or PBS (n=9) for three weeks. No significant difference in spleen weight was observed upon wogonin treatment (0.92g, SEM ± 0.13 in treated versus 1.08g, SEM ± 0.08 in control mice; Figure 7B), although there was a tendency, in the treated group, of slightly smaller spleens. Similar results were obtained for tumor load in the spleen, which was 61.10% (SEM ± 4.48) in wogonin-treated versus 68.28% (SEM ± 3.18) in control mice (Figure 7C). By contrast, the percentage of CD19+CD5+ cells in PB was significantly increased in treat- ed mice (74.67%, SEM ± 3.82) compared to controls (58.84%, SEM ± 3.39; P=0.01; Figure 7D). This significant increase persisted when CLL cell percentages after treat- ment were normalized to CD19+CD5+ percentages at the start of treatment, which was three weeks after AT of CLL (P=0.04; Figure 7E). To analyze whether this effect might be linked to the interference of wogonin with TNFR-1 signal- ing, we analyzed mTNFR-1 expression on splenic CLL cells after treatment. Interestingly, wogonin induced an almost complete loss of mTNFR-1 expression in CLL cells (MFI 1.50 in treated versus 3.53 in control mice; P=0.02; Figure 7F). This is most likely due to receptor shedding, since
Wogonin reduces CLL development in the TCL1 adoptive transfer model
As wogonin impaired NFκB activation and survival of CLL cells in vitro, we investigated its impact on leukemia development in the TCL1 AT model. Two days after transplantation of malignant cells, mice were randomized to daily treatment with 40 mg/kg wogonin or PBS by i.p. injection for three weeks (n=10; Figure 6A). Eight out of ten mice analyzed in this study responded to wogonin treatment with significantly lower spleen weights of an average of 0.25g (SEM ± 0.06) in treated mice as compared to 0.36g (SEM ± 0.04) in the control cohort (P=0.03; Figure 6B). To assess tumor load in all affected tissues, percent- ages of CD19+CD5+ cells of viable CD45+ cells were ana- lyzed in the spleen, PB and peritoneal cavity (PC) by flow cytometry. As depicted in Figure 6C, control mice exhibit- ed a median splenic tumor load of 23.78% (SEM ± 5.37), whereas CLL cells were almost completely absent in the eight mice responding to wogonin; the mean percentage of CLL cells in all treated animals, including the two non- responders, was 13.42% (SEM ± 7.32). Further, the CLL
haematologica | 2018; 103(4)
693
