
Page 150 - Haematologica-April 2018
P. 150
C. Dürr et al.
quantification of sTNFR-1 in the serum of these mice by ELISA revealed significantly higher levels of 4.22 ng/mL (SEM 0.34 ng/mL) in wogonin-treated mice compared to 2.79 ng/mL (SEM 0.23 ng/mL) in control mice (P=0.005; Figure 7G). This increase in sTNFR-1 levels in wogonin- treated mice is not a sign of disease progression, but rather a treatment effect, including enhanced TNFR-1 shedding
and mobilization of leukemic cells from the spleen to PB. Despite the fact that wogonin failed to effectively control advanced disease in mice, it had an impact on TNFR-1 expression, and was associated with an increased accumu- lation of malignant cells in PB, suggesting that prolonged treatment with wogonin, or combinations with other drugs, might lead to CLL-effective responses.
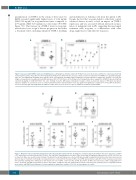
AB
Figure 5. CLL-associated TNFR-1 expression in Eμ-TCL1 mice. (A) Syngeneic, immunocompetent C57BL/6 mice were injected (i.v.) with 4 x 10⁷ splenocytes from fully leukemic Em-TCL1 mice (TCL1 AT; n=7). Non-transplanted C57BL/6 mice (WT; n=6) were used as controls. Serum concentrations of sTNFR-1 were quantified 42 days after CLL cell engraftment via ELISA. Lines indicate mean concentrations and SEM. Unpaired Student's t-test was applied for significance analysis (*P=0.04). (B) Single cell suspensions of peripheral blood (PB) and spleen (SP) of TCL1 AT mice (n=9) 42 days after transplantation were analyzed for mTNFR-1 expression by flow cytometry by gating on CD45+CD5+CD19+ CLL cells. Staining of relative MFI values normalized to isotype control are depicted. Values for PB (dots) and spleen (squares) samples of each mouse (1-9) are connected by dotted lines. Paired Student's t-test was applied for significance analysis (P<0.0001). MFI: median fluo- rescence intensity; IgG: immunoglobulin G; sTNFR-1: soluble tumor necrosis factor receptor-1: mTNFR-1: membrane-bound TNFR-1.
Figure 6. Wogonin reduces leukemia development in the TCL1 adoptive transfer model. (A) Syngeneic, immunocompenent C57BL/6 mice were injected (i.v.) with 4 x 10⁷ splenocytes from fully leukemic Em-TCL1 mice. Two days after transplantation, mice were either treated with 40 mg/kg/d wogonin (n=10) or PBS (ctl; n=10) by i.p. injections. Mice were sacrificed after 21 days of treatment. Serum and organs were collected. (B) Spleen weight of wogonin-treated and control mice was assessed after 21 days of treatment. (C-E) Single cell suspensions were collected from the spleen (SPL), blood (PB) and peritoneal cavity (PC). Tumor load was assessed by flow cytometry staining and is indicated as CD5+ CD19+ cells out of CD45+ cells in (C) SPL, (D) PB, (E) and PC. (F) Mice were injected i.p. with 0.1 mg/g EdU 20 h before sacrificing, and EdU incorporation in spleen CD5+ CD19+ malignant cells was analyzed after Click-iT reaction by flow cytometry. Lines in all graphs indicate mean values and SEM. Paired Student's t-test was applied for significance analysis (*P=0.03). d: day; g: gram; ctl: control.
A
CD
B
EF
694
haematologica | 2018; 103(4)
