
Page 151 - Haematologica-April 2018
P. 151
TNF receptor signaling as therapeutic target in CLL
Discussion
The relevance of microenvironmental interactions that mediate pro-survival signaling in CLL is now generally accepted. This is, however, thus far mainly based on in vitro studies, and their role in vivo still remains ill-defined. Interfering with the crosstalk of CLL cells and their microenvironment and thereby depriving malignant cells from supportive factors has become an attractive novel approach for treatment.
In the study herein, we identified TNFR-1 as a pivotal player in CLL pathology. We observed significantly elevat- ed sTNFR-1 serum levels in CLL patients, in line with results from Digel et al.16 We further showed that sTNFR-
1 levels correlate with β2-microglobulin and thymidine kinase serum levels, which are indicative for tumor load as well as with OS and TAD of CLL patients. Thereby, the prognostic power of sTNFR-1 was independent of estab- lished prognostic markers. These findings are in line with observed correlations of serum sTNFR-1 and disease aggressiveness in CLL, breast, colon, and pancreatic can- cer.15,16,29 We further showed that CLL development in Em- TCL1 mice is associated with elevated TNFR-1 serum lev- els. Taken together, our findings determine sTNFR-1 as a predictor for disease progression in CLL.
Albeit conflicting data has been presented concerning the expression of mTNFR-1 on freshly isolated PB-derived CLL cells,15,30,31 our results clearly demonstrate that these
A
B
CD
E
FG
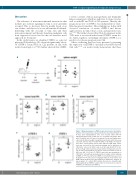
Figure 7. Wogonin impacts on TNFR-1 expression in vivo. (A) Adoptive transfer of TCL1 splenocytes was performed as described in Figure 6. At d21 after transplantation, mice were treated either with 40 mg/kg/d wogonin (n=5) or PBS (ctr; n = 9) by daily oral gavage. Mice were sacrificed after 21 days of treatment. Serum and organs were collected. (B) Spleen weight of wogonin-treated and control mice was assessed after 21 days of treatment (d42). (C-E) Single cell suspen- sions were collected from spleen (SPL) and blood (PB; d42). Tumor load was assessed by flow cytometry staining and is indicated as CD5+CD19+ cells out of CD45+ cells in (C) SPL and (D) PB (*P=0.01). (E) Percentage tumor load in blood was further normalized to percent- age at start of treatment in each mouse and is presented as ratio of d42 over d21 (*P=0.04). (F) TNFR-1 expression was quantified on CD5+CD19+ cells via flow cytometry relative to isotype control antibody (mTNFR-1; *P=0.02). (G) Serum sTNFR-1 concentration was assessed by ELISA (**P=0.005). Lines in all graphs indicate mean values and SEM. Paired Student's t-test was applied for significance analysis. d: day; g: gram; ctl: control; MFI: median fluorescence intensity; IgG: immunoglobulin G; sTNFR-1: soluble tumor necrosis factor receptor-1: mTNFR-1: membrane-bound TNFR-1.
haematologica | 2018; 103(4)
695
