
Page 148 - Haematologica-April 2018
P. 148
C. Dürr et al.
AB
CD
E
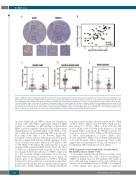
Figure 3. TNFR-1 is expressed by proliferating B cells in bone marrow and lymph nodes. Immunohistochemical staining of tissue microarrays containing lymph node (LN) sections and bone marrow (BM) trephine biopsies of CLL patients and healthy donors (HD) as well as sections of reactive LN were performed using CD20, Ki- 67 and TNFR-1 specific antibodies. (A) Representative micrographs of Ki-67 and TNFR-1 staining of a CLL LN section. (B) Correlation of percentages of Ki-67 positive cells and TNFR-1 positive cells in 58 CLL samples (38 LN and 20 BM). (C) CD20 positive B cells that co-expressed TNFR-1 were quantified in LN sections of CLL patients (n=38) and HD (n=14); (D) in germinal centers (GC) and marginal zones (MZ) of reactive LN sections (n=30); (E) and BM trephine biopsies isolated from CLL patients (n=20) and HD (n=16). Lines indicate mean percentage of TNFR-1 positive cells and SEM. Unpaired t-test with Welch's correction was applied for sig- nificance analysis (***P<0.0001; *P=0.04). ). CLL: chronic lymphocytic leukemia; TNFR-1: tumor necrosis factor receptor-1.
692
one day, which induced TNFR-1 expression. Stimulation of these cells with TNF-α significantly enhanced NFκB activity, as quantified by p65 binding to immobilized NFκB consensus sequence oligonucleotides (relative mean chemiluminescence intensity (MLI): 19.25; SEM ± 1.72), and could be blocked by neutralizing TNF-α-specific anti- body (MLI: 3.45; SEM ± 1.14; P=0.001; Figure 4A). Treatment of these cultures with the flavonoid wogonin, known to impair TNF-α-induced NFκB signaling,22 result- ed in a reduction of relative MLI from 2.78 (SEM ± 0.60) to 0.98 (SEM ± 0.53; Figure 4B), indicating that wogonin abolished TNF-α-induced NFκB activity. Next, the effect of TNF-α in combination with wogonin on cell survival was examined. After the induction of TNFR-1 expression by 1 day of culture in high cell densities, CLL cells were treated with increasing concentrations of wogonin, 30 minutes prior to the administration of TNF-α. Wogonin treatment for 24 h resulted in a concentration-dependent reduction in cell viability, that was significantly stronger in the presence of TNF-α (Figure 4C). Treatment with 50 μM
wogonin reduced average cell survival from 64.15% (SEM ± 1.80) to 44.72% (SEM ± 4.16; P=0.0003), which was fur- ther reduced to 37.92% (SEM ± 5.22; P=0.002) and 31.33% (SEM ± 2.99; P=0.004) in the presence of 10 and 50 ng/mL TNF-α, respectively. At 100 mM wogonin, sur- vival was reduced to 27.39% (SEM ± 2.95) in the absence of TNF-α, and furthermore, to 22.13% (SEM ± 2.67; P=0.01) and 21.63% (SEM ± 3.31; P=0.009) in the presence of 10 and 50 ng/mL TNF-α, respectively. These results suggest that wogonin impacts on CLL cell viability in vitro by inhibiting TNF-α-mediated survival signals.
TNFR-1 expression and serum levels are mirrored in the Eμ-TCL1 mouse model of CLL
To investigate whether the Em-TCL1 mouse line, a well- established animal model of CLL,24 mirrors our findings of TNFR-1 in human CLL, we first analyzed the serum of mice with end-stage leukemia (n=5), and confirmed an average of 3.2-fold higher levels of sTNFR-1 as compared to control animals (n=3; data not shown). A significant
haematologica | 2018; 103(4)
