
Page 147 - Haematologica-April 2018
P. 147
TNF receptor signaling as therapeutic target in CLL
AB
C
D
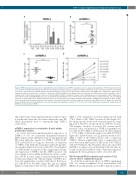
Figure 2. TNFR-1 expression in CLL cells is regulated by the microenvironment. (A) TNFR-1 transcript levels were analyzed by quantitative RT-PCR using CD19-sorted CLL cells (n=4) or healthy donor (HD) B cells (n=3) before (day [d]0) and after 1 day (d1) of cultivation in high cell density (2.5 x 10⁶ cells/mL). Results were normalized to the mean expression levels of HPRT, DCTN2, and PGK. (B) A total of 4 x 10⁵ CLL peripheral blood mononuclear cells (PBMC) were cultured for 1 day in 200 mL complete medium in 96-well plates. Cell surface expression of TNFR-1 (mTNFR-1) was quantified by flow cytometry in freshly isolated cells (d0) and after 1 day of cultivation (d1; n=14). Relative median fluorescence intensity (MFI) of TNFR-1 normalized to isotype control staining was assessed by gating on CD20+ lymphocytes. Lines indicate means and SEM. Significance was calculated by paired Student's t-test (***P=0.0005). (C+D) A total of 5 x 10⁵ CD19-sorted CLL cells or healthy B cells were cocultured with 1 x 10⁵ CD14-sorted monocytes for 1 or 7 days in 400 mL complete medium in 48-well plates. mTNFR-1 was quantified on CD20+ lympho- cytes by flow cytometry in freshly isolated cells (d0) and after cultivation (d1 and d7). Results are depicted as ratios of relative MFI on d1 or d7 versus d0. Lines show mean and SEM. Unpaired t-test with Welch's correction was applied for significance analysis (**P=0.001). CLL: chronic lymphocytic leukemia; PB: peripheral blood; mTNFR-1: membrane-bound TNFR-1.
CLL cells by microenvironmental stimuli, and the receptor is quickly shed from the cell surface when cells enter PB, which presumably leads to abnormally high TNFR-1 serum levels.
mTNFR-1 expression is restricted to B cells within proliferation centers
To verify microenvironment-regulated expression of TNFR-1 in vivo, we performed immunohistochemical (IHC) analysis of LN and BM sections of CLL patients and HD using antibodies specific for TNFR-1, CD20, Ki-67, CD3, and CD68. In so doing, we observed co-localization of TNFR-1 with CD20 (B-cell marker) and Ki-67 (prolifer- ation marker; Figure 3A), but not with CD3 (T-cell marker) or CD68 (marker for myeloid cells), suggesting B cell-spe- cific expression of TNFR-1. In LNs, TNFR-1 positive cells were mainly located within proliferation centers consist- ing of Ki-67 positive, large, round paraimmunoblasts in nodular areas (Figure 3A). The percentage of TNFR-1 pos- itive cells significantly correlated with that of Ki-67 posi- tive cells (R=0.39; P<0.0001; Figure 3B), and was slightly higher in CLL-derived LN sections (n=58) with 10.68%
(SEM ± 1.93) compared to non-CLL samples (n=14) with 7.76% (SEM ± 3.42) TNFR-1 positive B cells (Figure 3C). In both groups, the results were very heterogeneous, rang- ing from 0.1-51.33% in CLL and from 0-38.34% in non- CLL samples. Analysis of reactive LN sections (n=30) revealed a clear accumulation of TNFR-1 in germinal cen- ters with 17.48% (SEM ± 0.135) positive B cells compared to 1.74% (SEM ± 0.26) in the mantle zone (MZ; P<0.0001; Figure 3D). In BM biopsies of CLL patients (n=20), 4.12% (SEM ± 0.65) of the CD20 positive cells co-expressed TNFR-1, whereas significantly fewer co-expressing cells were detected in BM biopsies of HD (n=16; 2.38% SEM ± 0.46; P=0.04; Figure 3E). Altogether, these data show that mTNFR-1 is expressed by proliferating CLL cells that are localized in the LN and BM as well as by proliferating non- malignant B cells in germinal centers of reactive LN.
TNF-α induced NFκB activation and survival of CLL cells in vitro is reduced by wogonin
To study the downstream effects of TNFR-1 signaling in CLL, we cultured peripheral blood mononuclear cells (PBMC) from CLL patients (n=3) in 50% human serum for
haematologica | 2018; 103(4)
691
