
Page 146 - Haematologica-April 2018
P. 146
690
C. Dürr et al.
AB
C
DE
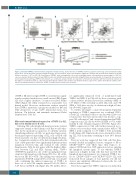
Figure 1. Elevated sTNFR-1 serum levels have prognostic relevance in CLL. (A) Serum levels of sTNFR-1 in 247 CLL patients and 50 age and sex-matched healthy donors were assessed by flow cytometry using bead arrays. The lines indicate mean concentrations. Significance analysis was performed via unpaired t-test with Welch's correction (***P<0.0001). (B) Correlations of sTNFR-1 and β2-microglobulin, (C) as well as thymidine kinase concentrations in serum samples of 247 CLL cases are depicted. (D) Associations of log2 sTNFR-1 serum concentration and overall survival, (E) along with tumor-associated deaths of CLL patients were assessed by Cox hazard model with log2 sTNFR-1 concentration as a continuous variable. Results are depicted in a Stone-Beran estimator, with the Stone-Beran estimate at the highest concentration shown as a blue line, the Stone-Beran estimate at the median concentration shown as a green line, and the Stone-Beran estimate at the lowest concentration shown as a black line. sTNFR-1: soluble tumor necrosis factor receptor-1.
sTNFR-1. Of interest, high sTNFR-1 concentrations signif- icantly correlated with shorter overall survival (OS) (Figure 1D) and a higher incidence of tumor-associated deaths (TAD) (Figure 1E) when evaluated in a univariable Cox hazard model. Moreover, multivariate analysis revealed that sTNFR-1 represents a prognostic marker for OS and TAD irrespective of age, IGHV mutational status, 11q deletion, 17p deletion, and rituximab treatment (Online Supplementary Table S3).
Microenvironment-induced expression of TNFR-1 in CLL but not in healthy donor B cells
Culturing CLL cells in high cell density provides survival supportive stimuli to the leukemic cells that would other- wise die by spontaneous apoptosis. To identify survival- stimulating pathways in CLL, we performed microarray- based gene expression profiling of CLL cells or HD B cells before and after one day of cultivation in high cell densi- ties. Comparative analyses of the data obtained resulted in a list of 236 genes that were significantly different in their regulation between CLL and normal B cells (Online Supplementary Table S4 lists genes with the highest differ- ence between CLL and HD). Among them, TNFR-1 (TNFRSF1A) appeared as one of the top upregulated tran- scripts in CLL (mean log2 fold change (FC) d1 vs. d0 =2.06), but not in HD (FC=-0.18). This finding was validated by quantitative RT-PCR using CD19-sorted CLL or normal B cells, confirming the induced expression of TNFR-1 in three out of four CLL samples (mean FC=10.13; SEM ± 3.27) but not in HD B cells (Figure 2A). We further detect-
ed significantly enhanced levels of membrane-bound TNFR-1 (mTNFR-1) in CLL cells by flow cytometry, with a mean relative median fluorescence intensity (MFI) of 1.37 (SEM ± 0.06) on freshly isolated CLL cells, and 7.35 (SEM ± 1.36) after one day of cultivation in high cell den- sity (P<0.001; Figure 2B).
To further investigate a microenvironment-dependent regulation of TNFR-1 expression, we cocultured CD19- sorted CLL or healthy B cells for one day with CD14-sort- ed monocytes that have previously been shown to sup- port CLL cell survival,4 and observed upregulated mTNFR- 1 expression in CLL cells by 4.08-fold (SEM ± 0.70), while healthy B cells remained negative (P=0.001; Figure 2C). TNFR-1 expression in CLL cells further increased in co- cultures over seven days with a mean relative MFI of 7.85 (SEM ± 2.62) compared to 1.37 (SEM ± 0.01) in healthy B cells (Figure 2D). Similar results were obtained by cultur- ing CLL cells in medium containing at least 20% human serum.
Previous work has suggested that CLL cells that have recently divided in lymphoid tissues, emigrate to PB as CXCR4dimCD5bright cells.27 Over time, they begin to re- express CXCR4 and lose CD5 expression, before entering the lymphoid system again. To test whether TNFR-1 expression is higher in CLL cells that have just left the lymphoid microenvironment, we compared TNFR-1 lev- els on CXCR4dimCD5bright and CXCR4brightCD5dim CLL cells from fresh blood samples of four patients, but did not observe any significant differences between the two cell subsets (data not shown).
These data suggest that TNFR-1 expression is induced in
haematologica | 2018; 103(4)
