
Page 117 - Haematologica-April 2018
P. 117
CD83 and Hodgkin lymphoma
inhibited CD2/CD3/CD28 bead stimulated T-cell prolifer- ation (Figure 4B) in a dose-dependent manner (Figure 4C). Only proliferation of CD8+ T cells seemed inhibited by KM-H2 supernatant (P=0.09), and not CD4+ T-cell prolif- eration (P=0.732). Administration of the anti-CD83 anti- body, 3C12C, partially abolished the inhibitory effect of KM-H2 supernatant (Figure 4D). 3C12C alone had no effect on T-cell proliferation (Figure 4E).
HL patient serum sCD83 declined to normal levels correlated with a complete or partial response
by PET-CT scan
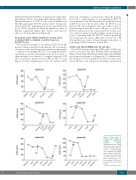
We monitored changes in circulating sCD83 in six HL patients during sequential chemotherapy. All assessments of response were made by positron emission tomography – computed tomography (PET-CT) scan using the Lugano classification system. All patients received 3-6 cycles of chemotherapy; five achieved a complete response (CR) and one patient a partial response (PR) by PET-CT scan (Figure 5, Online Supplementary Table S2). Serum sCD83
decreased, returning to normal levels when the patients had a CR to chemotherapy, as documented by PET-CT scan in patients #1 and #2. In patients #3 and #6, the serum sCD83 level was still elevated when the PET-CT scan showed CR but normalized after one further cycle of chemotherapy. Patient #4 showed a PR prior to cycle 5 by PET-CT-scan, however the serum sCD83 level only start- ed to decrease during cycle #5 reaching a normal range in cycle 6, coinciding with CR. PET-CT scans in patient #5 showed progressive disease (PD) after cycle 2, but a PR after another two cycles of chemotherapy, when the cor- responding sCD83 reduced to normal level.
3C12C and 3C12C-MMAE kills HL cell lines
The ADCC activity of the anti-CD83 mAb, 3C12C, was tested on the three HL lines: KM-H2, L428 and HDLM2. Whilst 3C12C killed KM-H2 and L428 efficiently, HDLM2 was relatively resistant to it (Figure 6A). To elucidate this, the stability of 3C12C binding on the HL cell surface were tested. HL lines were cultured in saturating concentration
Figure 5. Time course of soluble CD83 (sCD83) in Hodgkin lymphoma patients during chemotherapy. The sCD83 level in the sera of six HL patients during different cycles of chemotherapy was examined by ELISA. Arrows indicate when PET- CT scans were performed and the results of com- plete response (CR), par- tial response (PR) or pro- gressive disease (PD) are noted.
haematologica | 2018; 103(4)
661
