
Page 116 - Haematologica-April 2018
P. 116
Z. Li et al.
T cells cultured alone (Figure 3F,G). The CD83+CD4+ T
cells had the same proportion of regulatory T cells (Treg) as non-trogocytosed CD4+ T cells (Online Supplementary Figure S2).
Supernatant from HL cell lines inhibits T-cell proliferation
Surface CD83 can be cleaved into sCD83.15,20 We detect- ed it in the supernatants of activated DC and B lympho-
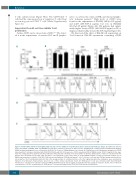
cytes,20 as well as the serum of NHL and chronic lympho- cytic leukemia patients.30 High levels of sCD83 were found in the supernatant of KM-H2 (460.6±11.8 pg/ml) and L428 (200.8±53.2 pg/ml), but low in HDLM2 (21.67±1.45 pg/ml) (Figure 4A). HL patients had signifi- cantly higher serum sCD83 (360.5±54.82 pg/ml, n=10) at diagnosis than healthy donors (52.6±9.5 pg/ml. Figure 4A).
We then tested the effect of KM-H2 cell supernatant on T-cell function. KM-H2 supernatant containing sCD83
A
B
C
D
E
Figure 4. Soluble CD83 (sCD83) from Hodgkin lymphoma (HL) cell lines inhibits T-cell proliferation which is abolished by binding to 3C12C. (A) sCD83 was detected in the supernatant of KM-H2, L428, and HDLM2 lines that were cultured for 24 hours at 1x10⁶/ml after changing fresh complete Roswell Park Memorial Institute (RPMI) medium and diagnostic sera of HL patients by ELISA. The P-value of A Mann-Whitney test is shown. (B) Carboxyfluorescein N-hydroxysuccinimidyl ester (CFSE)
660
labeled purified T cells were stimulated with CD2/CD3/CD28 beads (3:1) in the presence of 25% supernatant (SN) of KM-H2 or plus 3C12C (5 mg/ml) for five days. Cells were analyzed by flow cytometry and the proliferation index (PI), that is defined as the total number of divisions divided by the number of cells that went into division, were calculated for total CD3+, CD4+ and CD8+ T cells using Flow Jo (n=6). The P-value of one-way ANOVA analysis is shown. (C) Different volumes (v/v) of KM-H2 supernatant were added to CD2/CD3/CD28 microbead-stimulated CFSE-labeled human T cells. T cells were collected and CFSE was analyzed by flow cytom- etry at day five. The PI and division index (DI), that is the average number of cell divisions that a cell in the original population has undergone, were calculated as indicators for proliferation. Representative data from one of three similar experiments shown. (D) CFSE-labeled T cells were stimulated with CD2/CD3/CD28 microbeads. T cells were then cultured in 25% (v/v) KM-H2 SN with 3C12C (5 and 10 mg/ml). T-cell proliferation was analyzed on day five. (E) The effect of different concentrations of 3C12C on proliferation of CFSE-labeled T cells was determined after CD2/CD3/CD28 microbead stimulation.
haematologica | 2018; 103(4)
