
Page 115 - Haematologica-April 2018
P. 115
CD83 and Hodgkin lymphoma
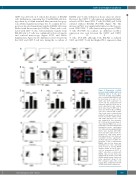
CD83 was detected on T cells in the absence of KM-H2 cells. Furthermore, separating the T and KM-H2 cells dur- ing culture by a 0.4mm transwell filter prevented trogocy- tosis (Online Supplementary Figure S2). To confirm the tro- gocytosis involved membrane transfer, KM-H2 cells were labeled with fluorescent dye (CellVue Claret) and co-cul- tured with CD3+ T cells. Cell membrane transfer from KM-H2 cells to T cells was confirmed by flow cytometry and confocal microscopy (Figure 3C,D, and Online Supplementary Figure S2). No differences were observed in the CD4+ and CD8+ T-cell ratio during the co-culture of
KM-H2 and T cells within four hours (data not shown). However, the CD83+ T cells expressed significantly high- er levels of PD-1 than CD83– T cells (P=0.048) and T cells cultured without KM-H2 (P=0.005) (Figure 3E). The increase in PD-1 was significantly higher on the trogocy- tosed CD83+CD4+ T cells than non-trogocytosed CD83– T cells (P=0.049). In contrast, no difference in PD-1 expression was seen between the CD83+ and CD83–
+
A
B
CD
C D 8
T cells, (P=0.185) although both KM-H2 co-cultured CD4+ and CD8+ T cells had higher PD-1 expression than
EF
Figure 3. Trogocytosis of CD83 molecule from Hodgkin and Reed- Sternberg cells to T cells. (A) T cells from healthy donor PBMCs were co-cultured with KM-H2 cells for four hours at a ratio of 1:5. CD83 and CD30 expression on CD3+T cells was analyzed by flow cytometry, data were from one of seven experiments and summa- rized data (mean± SEM and P- value) are shown in (B). (C) KM-H2 cells were labeled with CellVue Claret (red) and co-cultured with purified T cells (green) at a ratio of 5:1 for four hours. CellVue Claret and CD83 expression on T cells was analyzed by flow cytometry. (D) Confocal microscopy image of Claret labeled KMH2 cells co-cul- tured with T cells that stained with biotinylated mouse anti-human CD3 mAb and Stepdavidin-AF488. Nuclei were stained with DAPI. Scale bar: 5mm. Upper insert: tro- gocytosed T cells, lower insert: non-trogocytosed T cells. Data rep- resentative of three experiments. (E) PD-1 expression on CD83+ tro- gocytosed T cells co-cultured with KM-H2 cells for four hours was determined by flow cytometry (n=4). P-value of one-way ANOVA analysis shown. (F) PD-1 expres- sion on trogocytosed CD4+T or CD8+ T cells after co-culture with KM-H2 cells for four hours was analyzed (n=4). P-value of one-way ANOVA analysis shown. A represen- tative experiment shown in (G). FSC: forward scatter; SSC: side scatter; PD-1: programmed death- 1; FMO: fluorescence minus one.
G
haematologica | 2018; 103(4)
659
