
Page 177 - Haematologica - Vol. 105 n. 6 - June 2020
P. 177
DARS-AS1 promotes myeloma malignancy in hypoxia
Intriguingly, the knockdown of DARS-AS1 caused down- regulation of the level of RBM39 protein without decreas- ing the level of mRNA in both RPMI 8226 and LP-1 cells in the hypoxic environment (Figure 6A). However, the change in the RBM39 protein level was abolished by the presence of the proteasome inhibitor MG132 (Figure 6B), suggesting that DARS-AS1 may regulate the degradation of RBM39 in hypoxia. We also treated the DARS-AS1- knockdown and control MM cells with the protein syn- thesis inhibitor cycloheximide. As shown in Online Supplementary Figure S5D, the degradation rate of RBM39 was significantly accelerated in DARS-AS1 knockdown
A
myeloma cells in a hypoxic environment. Moreover, the knockdown of DARS-AS1 increased the ubiquitination of RBM39 in hypoxia (Figure 6C). In contrast, the overex- pression of DARS-AS1 reduced the ubiquitination of RBM39 (Figure 6D). These findings indicate that DARS- AS1 regulates the stability of RBM39 via the ubiquitin- proteasome pathway in a hypoxic environment.
The RBM39 protein is composed of an arginine-serine domain at the N terminus, followed by three predicted RNA recognition motifs (RRM) (Figure 6E). We next con- structed a series of RBM39 truncations (1-240, 241-400, 400-530, 1-400, and 241-530) to map its binding domains
B
CDE
FG
I
H
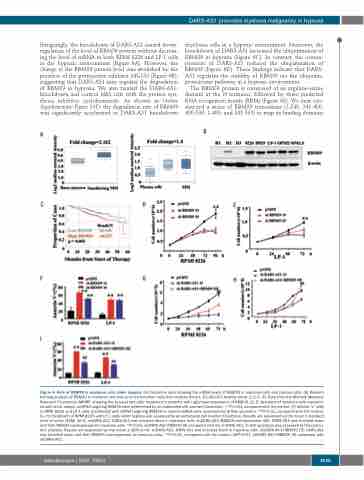
Figure 4. Role of RBM39 in myeloma cells under hypoxia. (A) Oncomine data showing the mRNA levels of RBM39 in myeloma cells and plasma cells. (B) Western blotting analysis of RBM39 in myeloma cell lines and mononuclear cells from healthy donors. D1/D2/D3: healthy donor 1/2/3. (C) Data from the Multiple Myeloma Research Foundation (MMRF) showing the survival rate after treatment in patients with high/lower expression of RBM39. (D, E) Numbers of myeloma cells transfect- ed with short hairpin (sh)RNA targeting RBM39 were determined by an automated cell counter (Countstar). **P<0.01, compared with the control. (F) Annexin V+ cells in RPMI 8226 and LP-1 cells transfected with shRNA targeting RBM39 or control shRNA were assessed using flow cytometry. **P<0.01, compared with the control. (G, H) The growth of RPMI 8226 and LP-1 cells under hypoxia was assessed by an automated cell counter (Countstar). Results are expressed as the mean ± standard error of mean (SEM) (n=3). shDARS-AS1: DARS-AS1 was knocked down in myeloma cells. shDARS-AS1+RBM39 overexpression (OE): DARS-AS1 was knocked down and then RBM39 overexpressed in myeloma cells. ##P<0.01, shDARS-AS1+RBM39 OE compared with the shDARS-AS1. (I) Cell apoptosis was assessed by flow cytom- etry analysis. Results are expressed as the mean ± SEM (n=3). shDARS-AS1: DARS-AS1 was knocked down in myeloma cells. shDARS-AS1+RBM39 OE: DARS-AS1 was knocked down and then RBM39 overexpressed in myeloma cells. **P<0.01, compared with the control. ##P<0.01, shDARS-AS1+RBM39 OE compared with shDARS-AS1.
haematologica | 2020; 105(6)
1635
