
Page 289 - Haematologica May 2020
P. 289
Modeling of FVIII activity, bleeds and covariates
lowing prophylactic treatment in patients with severe hemophilia A. To our knowledge, this is the first reported model characterization including longitudinal bleeding events for a replacement FVIII product. The model was based on observed data of plasma FVIII activity (PK com- ponent), bleeding time and severity (RTTCE component) and covariates, collected during the LEOPOLD studies. The final model satisfactorily described plasma FVIII activity and time- and PK-related probability of bleeding.
Besides LBW (included a priori influencing CL and V1), vWF and race correlated with CL, number of bleeds in the 12-month pre-study period correlated with the bleeding hazard, and age and vWF affected the severity of bleeding. However, even after identifying these covariate effects, the unexplained inter-individual variability on the bleed- ing hazard was high.
The covariate analysis allowed the exhaustive assess- ment of the clinical relevance of the correlation between
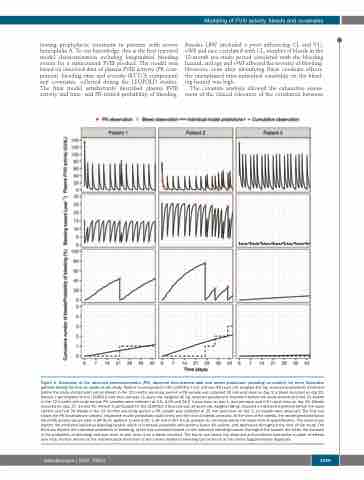
Figure 4. Illustration of the observed pharmacokinetics (PK), observed time-to-bleed data and model predictions (including co-variates) for three illustrative patients during the first six weeks in the study. Patient 1 participated in the LEOPOLD I trial and was 44 years old, weighed 107 kg, received prophylactic treatment before the study started and had six bleeds in the 12 months pre-study period; a PK sample was collected 25 min post-dose on day 1; a bleed occurred on day 22. Patient 2 participated in the LEOPOLD kids trial and was 11 years old, weighed 40 kg, received prophylactic treatment before the study started and had 15 bleeds in the 12 months pre-study period; PK samples were collected at 0.6, 4.25 and 24.2 h post-dose on day 1, and pre-dose and 0.5 h post-dose on day 35. Bleeds occurred on days 27, 33 and 41. Patient 3 participated in the LEOPOLD II trial and was 19 years old, weighed 68 kg, received on-demand treatment before the study started and had 36 bleeds in the 12 months pre-study period; a PK sample was collected at 25 min post-dose on day 1; no bleeds were observed. The first row shows the PK observations (circles), respective model predictions (solid lines) and the time of bleeds (crosses). At the time of the bleeds, the model-predicted factor VIII (FVIII) activity values were 0.38 IU/dL (patient 1) and 0.30, 1.39 and 0.367 IU/dL (patient 2), all values below the lower limit of quantification. The second row depicts the predicted individual bleeding hazard, which is inversely correlated with plasma factor VIII activity, and decreases throughout the time of the study. The third row depicts the individual probability of bleeding, which was calculated based on the individual bleeding hazard (the higher the hazard, the faster the increase in the probability of bleeding) and was reset to zero every time a bleed occurred. The fourth row shows the observed and predicted cumulative number of bleeds over time. Further details on the mathematical derivation of the curves related to bleeding can be found in the Online Supplementary Appendix.
haematologica | 2020; 105(5)
1449
