
Page 288 - Haematologica May 2020
P. 288
J.A. Abrantes et al.
priori in the PK structural model and the absence of a cor- relation between LBW on CL or V1 in the covariate analy- sis indicates that the relationship was well captured by the model. Other characteristics showed lower correlation coefficients, namely, Black race and Asian race decreasing and increasing CL (r=-0.25 and 0.17), respectively, and age and vWF being positively correlated to the severity of bleeding (r=0.23 and 0.28). In addition, correlations were identified between model parameters (e.g. CL and V1, r=0.45) and between covariates (e.g. treatment history and number of bleeds pre-study period, r=-0.71).
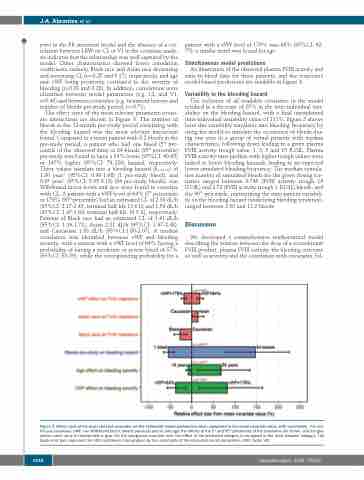
The effect sizes of the most relevant parameter-covari- ate interactions are shown in Figure 3. The number of bleeds in the 12-month pre-study period correlating with the bleeding hazard was the most relevant interaction found. Compared to a mean patient with 8.2 bleeds in the pre-study period, a patient who had one bleed (5th per- centile of the observed data) or 84 bleeds (95th percentile) pre-study was found to have a 54% lower (95%CI: 40-65) or 147% higher (95%CI: 79-226) hazard, respectively. These values translate into a bleeding hazard (λ0.5 IU/dL) of 1.30 year-1 (95%CI: 0.99-1.68) (1 pre-study bleed), and 6.97 year-1 (95%CI: 5.05-9.18) (84 pre-study bleeds). von Willebrand factor levels and race were found to correlate with CL. A patient with a vWF level of 64% (5th percentile) or 179% (95th percentile) had an estimated CL of 2.30 dL/h (95%CI: 2.17-2.45; terminal half-life 11.6 h) and 1.59 dL/h (95%CI: 1.47-1.69; terminal half-life 16.5 h), respectively. Patients of Black race had an estimated CL of 1.41 dL/h (95%CI: 1.16-1.71), Asian 2.21 dL/h (95%CI: 1.97-2.48), and Caucasian 1.93 dL/h (95%CI:1.80-2.07). A modest correlation was identified between vWF and bleeding severity, with a patient with a vWF level of 64% having a probability of having a moderate or severe bleed of 57% (95%CI: 55-59), while the corresponding probability for a
patient with a vWF level of 179% was 68% (95%CI: 62- 75); a similar trend was found for age.
Simultaneous model predictions
An illustration of the observed plasma FVIII activity and time-to-bleed data for three patients, and the respective model-based predictions are available in Figure 4.
Variability in the bleeding hazard
The inclusion of all available covariates in the model resulted in a decrease of 25% in the inter-individual vari- ability on the bleeding hazard, with a final unexplained inter-individual variability value of 111%. Figure 5 shows how this variability translates into bleeding frequency by using the model to simulate the occurrence of bleeds dur- ing one year in a group of virtual patients with median characteristics, following doses leading to a given plasma FVIII activity trough value: 1, 3, 5 and 15 IU/dL. Plasma FVIII activity-time profiles with higher trough values were linked to lower bleeding hazards, leading to an expected lower simulated bleeding frequency. The median cumula- tive number of simulated bleeds for the given dosing sce- narios ranged between 0.745 (FVIII activity trough 15 IU/dL) and 2.73 (FVIII activity trough 1 IU/dL) bleeds, and the 90th percentile, representing the inter-patient variabili- ty on the bleeding hazard (underlying bleeding tendency), ranged between 3.00 and 11.2 bleeds.
Discussion
We developed a comprehensive mathematical model describing the relation between the dose of a recombinant FVIII product, plasma FVIII activity, the bleeding outcome as well as severity and the correlation with covariates, fol-
Figure 3. Effect sizes of the most relevant covariates on the estimated model parameters when compared to the mean covariate value, with uncertainty. For con- tinuous covariates (vWF: von Willebrand factor, bleeds pre-study period, and age) the effects at the 5th and 95th percentiles of the covariates are shown, and the geo- metric mean value is represented in gray. For the categorical covariate race, the effect of the presented category is compared to the most frequent category. The black error bars represent the 95% confidence interval given by the uncertainty of the estimated model parameters. FVIII: factor VIII.
1448
haematologica | 2020; 105(5)
