
Page 287 - Haematologica May 2020
P. 287
Modeling of FVIII activity, bleeds and covariates
AB
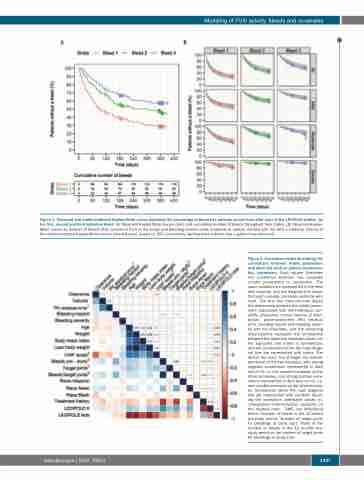
Figure 1. Observed and model-predicted Kaplan-Meier curves depicting the percentage of bleed-free patients versus time after start of the LEOPOLD studies, for the first, second and third individual bleed. (A) Observed Kaplan-Meier curves (plot) and cumulative number of bleeds throughout time (table). (B) Observed Kaplan- Meier curves by number of bleeds (first, second or third in the study) and bleeding severity (mild, moderate or severe) overlaid with the 95% confidence interval of the model-predicted Kaplan-Meier curves (shaded area), based on 200 simulations. Vertical lines indicate that a patient was censored.
Figure 2. Correlation matrix illustrating the correlations between model parameters and observed study or patient characteris- tics (covariates). Each square illustrates the correlation between two variables (model parameters or covariates). The same variables are represented in the rows and columns, and the diagonal line shows that each variable correlates perfectly with itself. The first five rows/columns depict the relationship between the model param- eters associated with inter-individual vari- ability [clearance, central volume of distri- bution, pharmacokinetic (PK) residual error, bleeding hazard and bleeding severi- ty] and the covariates, and the remaining rows/columns represent the correlations between the observed covariate values (on the log-scale). The matrix is symmetrical, and the correlations below the main diago- nal line are represented with colors. The darker the color, the stronger the interde- pendence of the two variables, with strong negative correlations represented in dark red (r=-1), i.e. one variable increases as the other decreases, and strong positive corre- lations represented in dark blue (r=+1), i.e. one variable increases as the other increas- es. Correlations above the main diagonal line are represented with numbers detail- ing the correlation coefficient values (r). 1Unexplained inter-individual variability on the residual error. 2VWF: von Willebrand factor. 3Number of bleeds in the 12-month pre-study period. 4Number of target joints for bleedings at study start. 5Ratio of the number of bleeds in the 12 months pre- study period to the number of target joints for bleedings at study start.
haematologica | 2020; 105(5)
1447
