
Page 290 - Haematologica May 2020
P. 290
J.A. Abrantes et al.
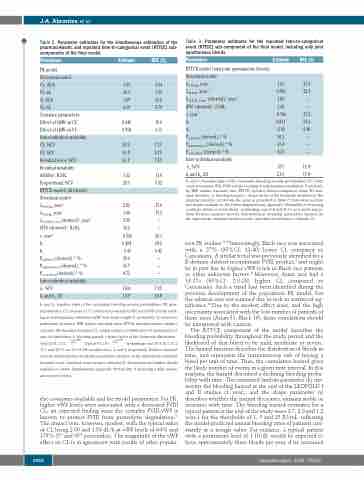
Table 2. Parameter estimates for the simultaneous estimation of the pharmacokinetic and repeated time-to-categorical event (RTTCE) sub- components of the final model.
Table 3. Parameter estimates for the repeated time-to-categorical event (RTTCE) sub-component of the final model, including only joint spontaneous bleeds.
Parameters
PK model
Structural model
CL, dL/h
V1, dL
Q, dL/h
V2, dL
Covariate parameters Effect of LBW on CLa Effect of LBW on V1a Inter-individual variability CL, %CV
V1, %CV
Residual error, %CV Residual variability Additive, IU/dL Proportional, %CV
RTTCE model (all bleeds) Structural model
Estimate RSE (%)
1.65 23.8 0.386 22.9 1.80 - 5.45 - -0.706 27.6 0.831 57.6 -3.95 9.40 30.3 - 65.4 - 4.23 -
157c 11.4d
2.13c 17.0d
b1 andb2:baselinelogitsofthecumulativebleedingseverityprobabilities;CV:coeffi-
cient of variation; IF50: FVIII activity resulting in half-maximum inhibition; P: probabil-
Estimate RSE (%)
1.93 3.54 30.3 1.72 1.69 23.0 6.29 8.79
0.646 10.0 0.958 3.13
30.2b 7.31c 15.1b 8.75c 63.1b 7.23c
1.52 11.0 20.3 5.52
2.82 17.6 1.00 17.3 2.96 - 10.2 -
-0.566 26.1 0.424 68.2 -3.43 6.42 39.6 - 55.7 - 4.72 -
the covariates available and the model parameters. For PK, higher vWF levels were associated with a decreased FVIII CL; an expected finding since the complex FVIII-vWF is known to protect FVIII from proteolytic degradation.41 The impact was, however, modest, with the typical value of CL being 2.30 and 1.59 dL/h at vWF levels of 64% and 179% (5th and 95th percentiles). The magnitude of the vWF effect on CL is in agreement with results of other popula-
Structural model
Parameters
RTTCE model (only joint spontaneous bleeds)
λ , year-1 0.5 IU/dL
λ , year-1 20 IU/dL
λ (derived)d, year-1 (0 IU/dL, 1 year)
IF50 (derived)a, IU/dL γ, year-1
b1
b2
(derived),a,b % Pmoderate bleed (derived),a,b %
P
mild bleed
-1 λ ,year
a mild,moderate or severe bleed. η-shrinkage was 21.8,and 35.1% on λ and b,respec- d
0.5 IU/dL
λ (derived)d, year-1 (0 IU/dL, 1 year)
tively. Relative standard error for inter-individual variability parameters reported on the approximate standard deviation scale (standard error/variance estimate)/2.
20 IU/dL
d
IF50 (derived) , IU/dL
γ, year-1
b1
b P2
d,e (derived), %
tion PK studies.42,43 Interestingly, Black race was associated with a 27% (95%CI: 12-40) lower CL compared to Caucasians. A similar trend was previously identified for a B-domain deleted recombinant FVIII product,6 and might be in part due to higher vWF levels in Black race patients
44
or other unknown factors. Moreover, Asian race had a
14.2% (95%CI: 2.0-28) higher CL compared to Caucasians. Such a trend had been identified during the previous development of the population PK model, but the relation was not retained due to lack to statistical sig- nificance.36 Due to the modest effect sizes, and the high uncertainty associated with the low number of patients of these races (Asian 31, Black 10), these correlations should be interpreted with caution.
The RTTCE component of the model describes the bleeding probability throughout the study period and the likelihood of that bleed to be mild, moderate or severe. The hazard function describes the distribution of bleeds in time, and represents the instantaneous risk of having a bleed per unit of time. Thus, the cumulative hazard gives the likely number of events in a given time interval. In this analysis, the hazard described a declining bleeding proba- bility with time. The estimated lambda parameter (λ) rep- resents the bleeding hazard at the end of the LEOPOLD I and II studies (1 year), and the shape parameter (γ) describes whether the hazard decreases, remains stable or increases with time. The bleeding hazard estimates for a typical patient at the end of the study were 2.7, 2.0 and 1.2 year-1 for the thresholds of 1, 5 and 15 IU/mL, reflecting the model-predicted annual bleeding rates of patients con- stantly at a trough value. For instance, a typical patient with a permanent level of 1 IU/dL would be expected to have approximately three bleeds per year, if he remained
Pmild bleed (derived),d,e moderate bleed
%
d,e
P (derived), %
severe bleed
Inter-individual variability
λ, %CV
b1 and b2, SD
b1 and b2: baseline logits of the cumulative bleeding severity probabilities; PK: phar- macokinetics; CL: clearance; CV: coefficient of variation; IF50: factor VIII activity result- ing in half-maximum inhibition; LBW: lean body weight; P: probability; Q: inter-com- partmental clearance; RSE: relative standard error; RTTCE: repeated time-to-categori- cal event; SD: standard deviation;V1: central volume of distribution;V2: peripheral vol- ume of distribution; λ: bleeding hazard; γ: shape factor of the Gompertz distribution. atypical CL = CL · , typical V1 = V1 · bη-shrinkage was 10.4, 16.1, 11.2, 15.1, and 26.7% on CL,V1, PK residual error, λ and b, respectively. cRelative standard error for inter-individual variability parameters reported on the approximate standard deviation scale (standard error/variance estimate)/2. dDerivations and further details available in Online Supplementary Appendix. eProbability of observing a mild, moder- ate or severe bleed.
Psevere bleed (derived),a,b % Inter-individual variability
λ, %CV
b1 and b2, SD
-1 λ ,year
dard deviation; λ: bleeding hazard; γ : shape factor of the Gompertz distribution.The a
ity; RSE: relative standard error; RTTCE: repeated time-to-categorical event; SD: stan-
pharmacokinetics model was the same as presented in Table 2. Derivations and fur-
ther details available in the Online Supplementary Appendix.bProbability of observing c
136b 7.95c 1.67b 10.8c
1450
haematologica | 2020; 105(5)
