
Page 240 - Haematologica May 2020
P. 240
P.J. Teoh et al.
B
C
A
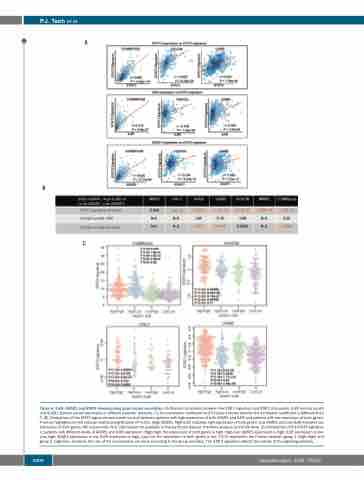
Figure 6. IL6R, ADAR1 and STAT3 demonstrated good clinical correlation. (A) Pearson correlation between the STAT3 signature and STAT3 (top panel), IL6R (central panel) and ADAR1 (bottom panel) expression in different patients’ datasets. r is the correlation coefficient and P-values indicate whether the correlation coefficient is different from 0. (B) Comparison of the STAT3 signature and overall survival between patients with high expression of both ADAR1 and IL6R and patients with low expression of both genes. P-values highlighted in red indicate statistical significance (P<0.05). (High-ADAR1, High-IL6R indicates high expression of both genes; Low-ADAR1 and Low-IL6R indicates low expression of both genes. HR: hazard ratio. N.A.: information not available in that particular dataset, therefore analysis cannot be done. (C) Comparison of the STAT3 signature in patients with different levels of ADAR1 and IL6R expression. High/high: the expression of both genes is high. High/low: ADAR1 expression is high, IL6R expression is low. Low/high: ADAR1 expression is low, IL6R expression is high, Low/low: the expression of both genes is low. P(1:2) represents the P-value between group 1 (high/high) and group 2 (high/low). Similarly, the rest of the comparisons are done according to the group numbers. The STAT3 signature reflects the activity of the signaling pathway.
1400
haematologica | 2020; 105(5)
