
Page 224 - Haematologica May 2020
P. 224
J. Edelmann et al.
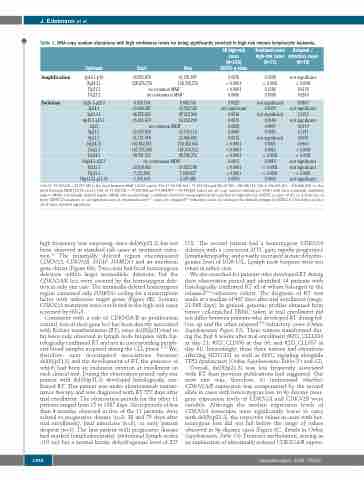
Table 1. DNA copy number alterations with high confidence levels for being significantly enriched in high-risk chronic lymphocytic leukemia.
All high-risk cases [N=146] GISTIC q-value
0.0070 < 0.0001 < 0.0001 0.0006
0.0025 not significant 0.0016 0.0070 0.0008 0.0005 0.0012
< 0.0001
< 0.0001
< 0.0001 0.0023
< 0.0001
< 0.0001 0.0094
Treatment-naïve Relapsed / high-riskcases refractorycases
Amplification
Deletion
Cytoband
2p16.1-p15 8q24.21 17p11.2 17q23.2
3p26.1-p25.3 3p24.1 3p21.31 4p15.2-p15.1 6q21 8p21.3 9p21.3 10q24.32 11q22.3 13q14.3 14q24.3-q32.1 15q15.1 17p13.1 18p11.32-p11.31
Start
59,872,879 128,276,750
Stop
61,781,897 128,338,750
[N=71]
0.0308 < 0.0001 0.1248 0.0308
not significant 0.0039 not significant 0.0140 0.0497 0.0083 not significant 0.0003 0.0013
< 0.0001 0.0418
< 0.0001
< 0.0001 0.0006
[N=75]
not significant < 0.0001 0.0118 0.0260
0.0867 not significant 0.1355 not significant 0.0119 0.1181 0.0076 0.0960
< 0.0001
< 0.0001 not significant not significant < 0.0001 not significant
no common MAR 1 no continuous MAR2
8,459,754 9,005,743 29,680,087 29,722,568 46,872,865 47,222,966 25,031,670 30,250,789 no common MDR3
22,075,838 23,155,110 21,151,950 22,445,892
103,862,811 107,595,005 49,541,515
104,452,562 107,673,512 49,786,376
no continuous MDR4
39,834,465 7,223,868 1,339,610
39,925,748 7,604,837 6,397,482
1Chr17:19,330,676–20,077,185isthemostfrequentMAR[10/12cases];2Chr17:56,343,164–57,575,244and58,167,359–58,198,114;3Chr6:106,415,362 –106,820,208 is the most frequent MDR [12/14 cases]; 4Chr 14: 77,238,552 – 77,275,608 and 77,898,877 – 93,494,856. Listed are all copy number alterations (CNA) with their minimally amplified region (MAR) / minimally deleted region (MDR) that reached high confidence levels for being significantly enriched in high-risk CLL (GISTIC q value <0.01) in at least one of three GISTIC2.0 analyses:(i) all high-risk cases,(ii) treatment-naïveTP53- cases,(iii) relapsedTP53-/refractory cases.According to the default settings of GISTIC2.0,CNA with a q value <0.25 were deemed significant.
high frequency was surprising, since del(9)(p21.3) has not been observed in standard-risk cases at treatment initia- tion.13 The minimally deleted region encompassed CDKN2A, CDKN2B, MTAP, DMRTA1 and an interferon gene cluster (Figure 6A). Two cases had focal homozygous deletions within larger monoallelic deletions, but the CDKN2A/B loci were covered by the homozygous dele- tion in only one case. The minimally deleted homozygous region contained only DMRTA1 coding for a transcription factor with unknown target genes (Figure 6B). Somatic CDKN2A mutations were not found in the high-risk cases screened by tNGS.
Consistent with a role of CDKN2A/B in proliferation control, loss of their gene loci has been directly associated with Richter transformation (RT), since del(9)(p21) had so far been only observed in lymph node biopsies with his- tologically confirmed RT and not in corresponding periph- eral blood samples acquired during the CLL phase.27,28 We, therefore, next investigated associations between del(9)(p21.3) and the development of RT, the presence of which had been an exclusion criterion at enrollment on each clinical trial. During the observation period, only one patient with del(9)(p21.3) developed histologically con- firmed RT. This patient was under alemtuzumab mainte- nance therapy and was diagnosed with RT 557 days after trial enrollment. The observation periods for the other 11 patients ranged from 15 to 1387 days. Short periods of less than 4 months, observed in five of the 11 patients, were related to progressive disease (n=2; 38 and 75 days after trial enrollment), fatal infections (n=3), or early patient dropout (n=1). The first patient with progressive disease had marked lymphadenopathy (abdominal lymph nodes >10 cm) but a normal lactate dehydrogenase level of 227
U/L. The second patient had a homozygous CDKN2A deletion with a concurrent MYC gain, rapidly progressive lymphadenopathy, and a vastly increased lactate dehydro- genase level of 1026 U/L. Lymph node biopsies were not taken in either case.
We also searched for patients who developed RT during their observation period and identified 14 patients with histologically confirmed RT all of whom belonged to the relapsedTP53-/refractory cohort. The diagnosis of RT was made at a median of 407 days after trial enrollment (range, 21-568 days). In general, genomic profiles obtained from tumor cell-enriched PBMC taken at trial enrollment did not differ between patients who developed RT during fol- low up and the other relapsedTP53-/refractory cases (Online Supplementary Figure S2). Three tumors transformed dur- ing the first 6 weeks after trial enrollment (#2O_CLLL033 at day 21; #2O_CLL056 at day 36; and #2O_CLL037 at day 41). Interestingly, these three tumors had alterations affecting NOTCH1 as well as MYC signaling alongside TP53 dysfunction (Online Supplementary Tables S1 and S2).
Overall, del(9)(p21.3) was less frequently associated with RT than previous publications had suggested. Our next aim was, therefore, to understand whether CDKN2A/B expression was compensated by the second allele in cases with heterozygous loss. In 9p disome cases, gene expression levels of CDKN2A and CDKN2B were variable. Although the median expression levels of CDKN2A transcripts were significantly lower in cases with del(9)(p21.3), the respective values in cases with het- erozygous loss did not fall below the range of values observed in 9p disome cases (Figure 6C, details in Online Supplementary Table S3). Promoter methylation, serving as an explanation of abnormally reduced CDKN2A/B expres-
1384
haematologica | 2020; 105(5)
