
Page 222 - Haematologica May 2020
P. 222
J. Edelmann et al.
cases with those observed in treatment-naïve standard- risk cases. Apart from +(2)(p16.1 p15) and del(6)(q21), all CNA listed in Table 1 occurred at least two times more often in the cohort of high-risk cases: +(8)(q24.21) in 16.4% versus 3.6%, del(8)(p23.1) in 15.8% versus 0.3%, del(18)(p11.31) in 13.7% versus 2.0%, del(10)(q24.32) in 11.0% versus 1.3%, del(15)(q15.1) in 10.3% versus 3.6%, del(3)(p21.31) in 10.3% versus 0.3%, and del(14q) in 7.5% versus 0.7%. Losses in 14q were heterogeneous and a con- tinuous minimally deleted region could not be identified. The two minimally deleted regions in 14q24.3 and 14q31.3 were defined by one case with a discontinuous deletion.
GISTIC2.0 also assigned q values <0.01 to novel CNA: +(17)(p11.2) found in 8.2%, +(17)(q23.2) in 7.5%, del(3)(p25.3) in 9.6%, del(3)(p24.1) in 8.9%, del(4)(p15.2) in 8.2%, and del(9)(p21.3) in 8.9% of high-risk cases. Boundaries of minimally affected chromosomal regions in 3p25.3, 3p24.1, and 17q23.2 derived from complex dis- continuous CNA.
GISTIC2.0 results for the treatment naïveTP53- and relapsedTP53-/refractory cohort shared similarities, but the latter group had fewer significant CNA. This suggested a selection of clones with CNA contributing to CLL high- risk biology and failure of previous chemo(immuno)ther- apy. In the relapsedTP53-/refractory cohort, only gain(8)(q24.21) and del(9)(p21.3) retained GISTIC q val- ues <0.01 beyond CNA routinely assessed by FISH (Table 1). Of note, the minimally affected regions in 8q24.21 and 9p21.3 both contained key regulators of cell cycle pro- gression, namely MYC and CDKN2A/B.
In contrast, del(18p), del(15)(q15.1), del(4)(p15), del(14q) and gain(2p) failed to reach significant GISTIC q values in the relapsedTP53-/refractory cohort, so that these CNA less likely conferred refractoriness.
We next analyzed the 146 high-risk cases for associa- tions between genomic lesions. The distribution of genomic lesions across samples is depicted in Figure 4 for relapsedTP53-/refractory cases and in Online Supplementary Figure S1 for treatment naïveTP53- cases. Comparing cases with and without TP53 alteration, only del(11)(q22.3) sig- nificantly associated with refractoryTP53 intact cases (P<0.01). Testing for dependence of a genomic lesion on the pres- ence of a TP53 alteration was hampered by the low num- ber of refractoryTP53 intact cases included in the study. Loss of CDKN2A/B was associated with gain of the MYC gene locus, with MGA mutation, and with loss of MGA by del(15)(q15.1) (P=0.028, P=0.044, and P=0.03, respective- ly). Interestingly, cases with co-occurring CDKN2A/B loss and MYC gain were among those with the shortest telomeres as a potential sign of higher proliferation rates in these tumors. Co-occurrence of coding NOTCH1 and SF3B1 mutations was lower than would have been expected to occur by chance (3/145 cases, P=0.034), although both mutations were frequent. NOTCH1 muta- tions occurred in 24% relapsedTP53-/refractory and 21% treatment-naïveTP53- cases and SF3B1 mutations in 24% relapsedTP53-/refractory and 23% treatment naïveTP53- cases.
Lastly, to identify distinct molecular pathways affected by CNA with significant GISTIC q values, we analyzed genes located in minimally involved regions as shown in Table 1 by PathVisio. PathVisio assigned significance to 29 pathways. Due to TP53, ATM, and CDKN2A/B loss and MYC gain, 12 of 29 pathways were related to DNA damage response, apoptosis or cell cycle control. Of note, “NOTCH1 signaling” was identified as one significant pathway based on loss of two genes associated with NOTCH1 target gene repression (RPBJ and SNW1) and gain of the NOTCH1 target gene MYC. Toll like receptor signaling was the pathway with the most significant P
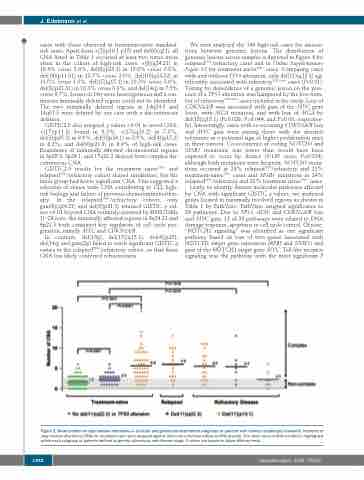
Figure 2. Mean number of copy number alterations in clinically and genetically determined subgroups of patients with chronic lymphocytic leukemia. Numbers of copy number alterations (CNA) for all patients who were analyzed against their intra-individual reference DNA (paired). The mean value of CNA numbers is highlighted within each subgroup of patients defined by genetic alterations and disease stage. P values are based on Mann-Whitney tests.
1382
haematologica | 2020; 105(5)
