
Page 57 - Haematologica April 2020
P. 57
Megakaryocytes modulate BM cell mobilization
of the stack megakaryocyte diameters on day 0 and 3, respectively (Figure 1C, Online Supplementary Table S1).
As we measured clear bias by analysis of the sliced stack, we wondered whether there was a megakaryocyte num- ber bias in slices. Here, we first determined the ground truth of intact stacks by counting megakaryocytes, and normalizing the number to a defined volume of BM: nMK_day0 = 20801 ± 4223 megakaryocytes/mm3 and nMK_day3 = 15992 ± 1700 megakaryocytes/mm3 in stacks and exemplified slices alike. We set a threshold megakaryocyte size to dis- card artifacts and cell fragments. In stacks, we defined 525 μm3 (equivalent to 10 μm sphere diameter) as the mini- mum megakaryocyte volume. In slices we applied a range of increasing minimum diameter thresholds (1 μm to 30 μm), and compared the deviation to stack megakaryocyte numbers. Lower thresholds resulted in massive overesti- mation of megakaryocyte numbers, from roughly 500% with the 1 μm threshold to around 200% with the 10 μm threshold. We measured stack-comparable megakaryocyte numbers at 15 μm and 15/20 μm on day 0 and 3, respec- tively. Higher diameter thresholds led to significant under- estimation of in-slice megakaryocyte numbers at both time points (Figure 1D).
An iterative multi-step image processing pipeline is essential for reliable segmentation of megakaryocytes
Megakaryocyte segmentation was challenging because of the considerable variability in cell shape and size, rang- ing over several orders of magnitude, hampering pre- and post-segmentation artifact removal. To optimize the analysis, we tested four different analysis pipelines, using both FIJI and Imaris for different tasks, and compared their segmentation performance: (i) Imaris cell mem- brane, (ii) one-pass, (iii) two-pass, and (iv) custom- designed. A manual side-by-side comparison of their rel- ative performance (Figure 2, Online Supplementary Figures S1 and S2, Table 1) revealed a severe amount of fake invaginations and false seeding points for (i)-(iii), although the effect was least severe for (iii). Thus, we suc- cessfully extended the two-pass pipeline into a (iv) cus- tomized pipeline by one additional step of correction (Figure 2D, Online Supplementary Figure S2D), achieving a superior performance and minimizing artifacts compared to the previous algorithms. The Imaris cell membrane tool showed the most severe underperformance: megakaryocyte-to-marrow volume fraction, normalized mean megakaryocyte numbers, and mean megakary- ocyte volume were greatly underestimated. Overall, only a few megakaryocytes were recognized and only the unstained innermost lumen was segmented. The one- pass pipeline delivered megakaryocytes to the same mar- row fractions as our customized pipeline. However, the strong increase of normalized mean megakaryocyte num- bers and the decrease in mean megakaryocyte volumes indicated high over-segmentation of megakaryocytes. The two-pass pipeline, as the direct progenitor of our cus- tomized pipeline, performed better in the comparison of (i) and (iii). We found comparable values for total megakaryocyte volume fraction (normalized to marrow volume) and mean megakaryocyte numbers. However, for the much larger megakaryocytes on day 3 after platelet depletion, the mean megakaryocyte volume was underestimated by 16% while no deviation was observed for the smaller megakaryocytes on day 0.
The results suggest that the suitability and performance
of pipelines (i)-(iii) depend on the volume of the megakaryocytes. To pinpoint this correlation, we sorted our data by megakaryocyte volume, and compared devia- tions of megakaryocyte numbers and volumes systemati- cally to our optimized custom pipeline (Online Supplementary Figure S1): the greatest deviation was shown by (i) which underestimated megakaryocyte num- bers throughout all volume classes. Large megakaryocytes were widely neglected, while the volume of small megakaryocytes was overrepresented due to over-frag- mentation. The same tendency, albeit less pronounced, was observed for (ii) (Online Supplementary Figure S1). Pipeline (iii) performed more comparably to (iv). However, the numbers of very small megakaryocytes were still slightly overestimated on both day 0 and day 3, and we found significantly underestimated numbers of mid-to-larger megakaryocytes on day 3. Volumes of the largest megakaryocytes were significantly underestimated on both days (Online Supplementary Figure S1).
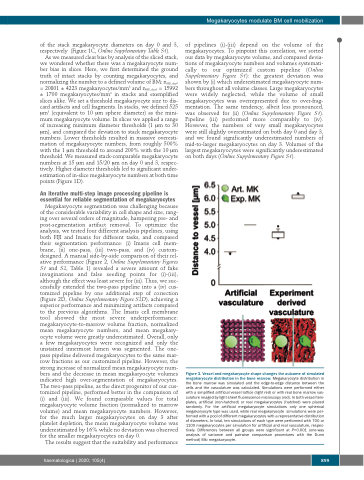
Figure 3. Vessel and megakaryocyte shape changes the outcome of simulated megakaryocyte distribution in the bone marrow. Megakaryocyte distribution in the bone marrow was simulated and the edge-to-edge distance between the cells and the vasculature was calculated. Simulations were performed either with a simplified artificial vessel lattice (light red) or with real bone marrow vas- culature imaged by light sheet fluorescence microscopy (red). In both vessel tem- plates, artificial (non-hatched) or real megakaryocytes (hatched) were placed randomly. For the artificial megakaryocyte simulations only one spherical megakaryocyte type was used, while real megakaryocyte simulations were per- formed with a pool of different megakaryocytes with a representative distribution of diameters. In total, ten simulations of each type were performed with 700 or 1100 megakaryocytes per simulation for artificial and real vasculature, respec- tively. Differences between all groups were significant at P<0.001 (one-way analysis of variance and pairwise comparison procedures with the Dunn method) Mk: megakaryocyte.
haematologica | 2020; 105(4)
899
